| Suppose you need to shut down the flow in a pipeline in a specified period of time. This action will always cause a pressure surge related to the deceleration of the fluid in the pipeline. The type of valve you use and how it is operated can have a very significant effect on the magnitude of the pressure surge and can provide protection against the development of an excessive pressure surge. |
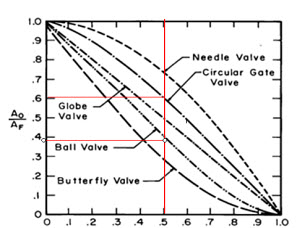
| The magnitude of a pressure surge associated with a valve closure largely depends on the closure characteristics of the valve. Figure 1 shows the closure characteristics of some standard types of valves. The effective flow area ratio Ao/AF is based on the geometry of the valve and is essentially equivalent to the Cv ratio for the valve. This figure shows, for example, that when a gate valve stem movement position is at 50% open the Cv ratio is 61% while for a ball valve it is only 38%. This means that the ball valve exerts significantly more control on the flow when the valves are in the 50% stem movement position. Valves which exert more control earlier tend to throttle the flow more evenly and, thus, limit the deceleration during the final stages of closure resulting in lower pressure surges for valve closures occurring over the same time period. |
 |
| Figure 1 Open Ratio vs Stem Movement Position for Standard Valves |
| In order to demonstrate this a 10 second valve closure on the downstream end of a 6 inch, 1000 foot long pipeline carrying 400 gpm of water was analyzed for both a gate and ball valve with a 100% Cv = 1500. Figure 2 shows the pressure transient for a 10 second valve closure initiated 1 second into the simulation. The pressure surge for the gate valve was 190 psi compared to 165 psi for the ball valve. Figure 3 depict the flow variation and shows that neither valve has a significant effect on the flow until around 8 seconds (valve stroke around 70% complete). The ball valve does throttle the flow at a much higher rate than the gate valve after 8 seconds resulting in a significant reduction in the liquid deceleration at the time of complete closure. |

|
| Figure 2 Pressure Surge due to 10 second valve closure |
 |
Figure 3 Flow variations due to 10 second valve closure |
| Neither of these valves throttled the flow effectively during the initial phase of the closure stroke. This demonstration effectively illustrates the problem with most valves from the standpoint of providing closures which limit pressure surge. Most valves provide very little control during the initial 50-80 % of the closure. Because of this the actual deceleration of the fluid is much greater than one might expect for a 10 second closure of a 400 gpm flow. The problem of the lack of control during the initial stages of valve closure is familiar to everyone who has closed the valve to a garden hose of just an ordinary faucet. Normally the valve needs to be 70 – 90 % closed before the valve closing action has a significant effect on the flow. |
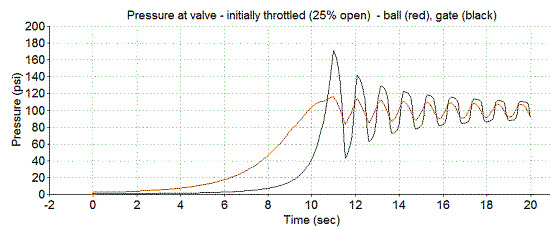
| A simple and effective way to reduce the surge pressure due to a fixed time valve closure is to initially throttle the valve. For many situations throttling the valve to 25% open (stem position), for example, will have very little effect on the steady state operation but will result is a significant reduction in the pressure surge following valve closure. Figure 4 shows the pressure surge generated by closing a gate and ball valve which are initially throttled to 25% of the stem position. The maximum surge pressure is reduced from 190 to 170 psi for the gate valve and from 165 to 115 psi for the ball valve. |
 |
Figure 4 Pressure Surge due to 10 second valve closure valves initially throttled to 25% open |
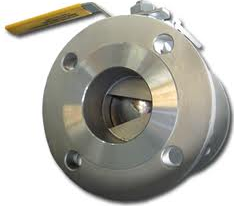
| Selecting a valve which provides good control throughout it entire opening and closing stroke often provides much improved operations and also can result in much lower pressure surges following a valve closure. One such valve is a V Notch Ball valve. A number of these types with 15, 30, 60 and 90 degree notches are available. Figure 5 (below) shows a 30 degree V Notch Ball Valve. |

|
| Figure 5 |
| Figure 6 shows the pressure surge following a 10 second closure of this valve and compares it to the pressure surge generated by the closure of a standard ball valve. As shown the maximum pressure due to the valve closure is lowered from 165 psi to 115 psi by the use of this valve. Of course the V Notch Ball Valve has a significantly lower Cv than the standard ball valve. For this case the Cv 100% = 350 for the 30 degree V Notch vs 1500 for the standard ball valve. In most applications this will not be a significant problem, The pressure drop across the V Notch valve at 400 gpm is 1.3 psi vs 0.1 psi for the standard valve. |
 |
Figure 6 Pressure Surge due to 10 second valve closure of standard vs 30 degree V Notch Ball Valve |
| Summarizing, it is possible to limit the pressure surge following a valve closure by selecting a valve with closure characteristics providing more control during the initial part of the closure stroke. Also modifying the operation of the valve by throttling the valve during normal operation can often significantly reduce pressure surges following valve closures. Finally there are designs available to increase control during the closure stroke which will produce reduced pressure surges. Selecting and operating a valve to lower the valve closure surge pressure often provides economical and effective option for surge protection. |


