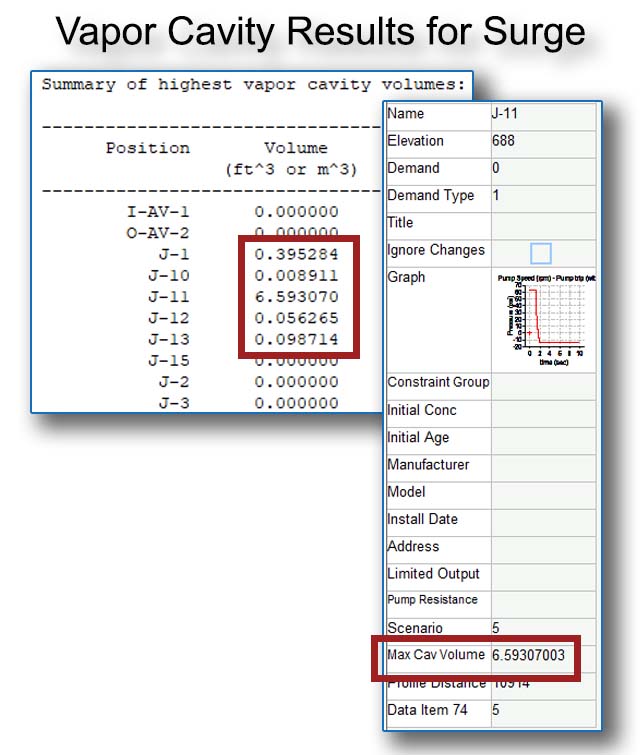
Maximum Cavitation Volume Now Available. Previously, Surge computed the cavitation volume at each node, but these data were not readily available to the user. New for Surge in 2024, the software now reports the Maximum Cavitation Volume for the entire analytical run. These data are available both as a Report (encompassing the maximum cavitation volume at all nodes throughout the simulation) as well as an individual result that can be seen within the Node Info Window (which reports the mazimum cavitation volume for the entire the simulation at that node only).
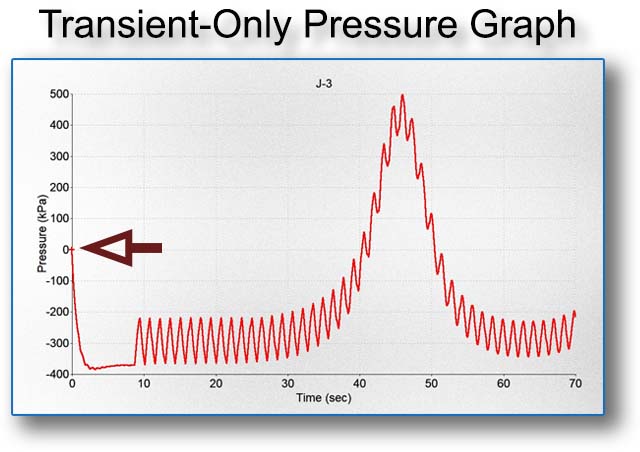
Transient Pressure Graph and Table. Formerly, Surge results were shown within graphs and tables as regular pressure results (i.e., the gauge pressure within the system). New for Pipe2024, This feature allows the user to plot/view only the transient-related pressures within graphs and tables – the steady-state pressures are mathematically removed from the curves/results so that graphs and tables only display the effects due to the transient-producing event(s). Thus, the pressure value on the graph starts at 0 psi instead of the steady-state gauge pressure within the system.