Overview. Users can generate, display and print contour maps for a variety of node data and results (e.g., elevation, pressure). Many contour types may be created, including shaded regions and line contours. Also, color emphasis can be used to set the color of nodes or pipes as well as creating background contours. Color gradations can be assigned based on user-entered data, or simulation results:
Show Animated Contours for Each Time/Case: Animated contours can be displayed if your simulation has multiple times or cases. The software can also create AVI files of this animation. There are no longer any significant memory requirement associated with very large AVI files.
Combine Different Times/Cases When Emphasizing and Contouring: For example, pressure contours for time 7.5 can be displayed simultaneously with color emphasis of node demands at time 7.5 and color emphasis of pipe flows at time 10.25.
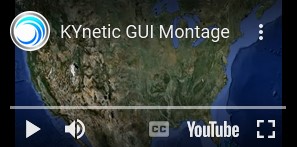
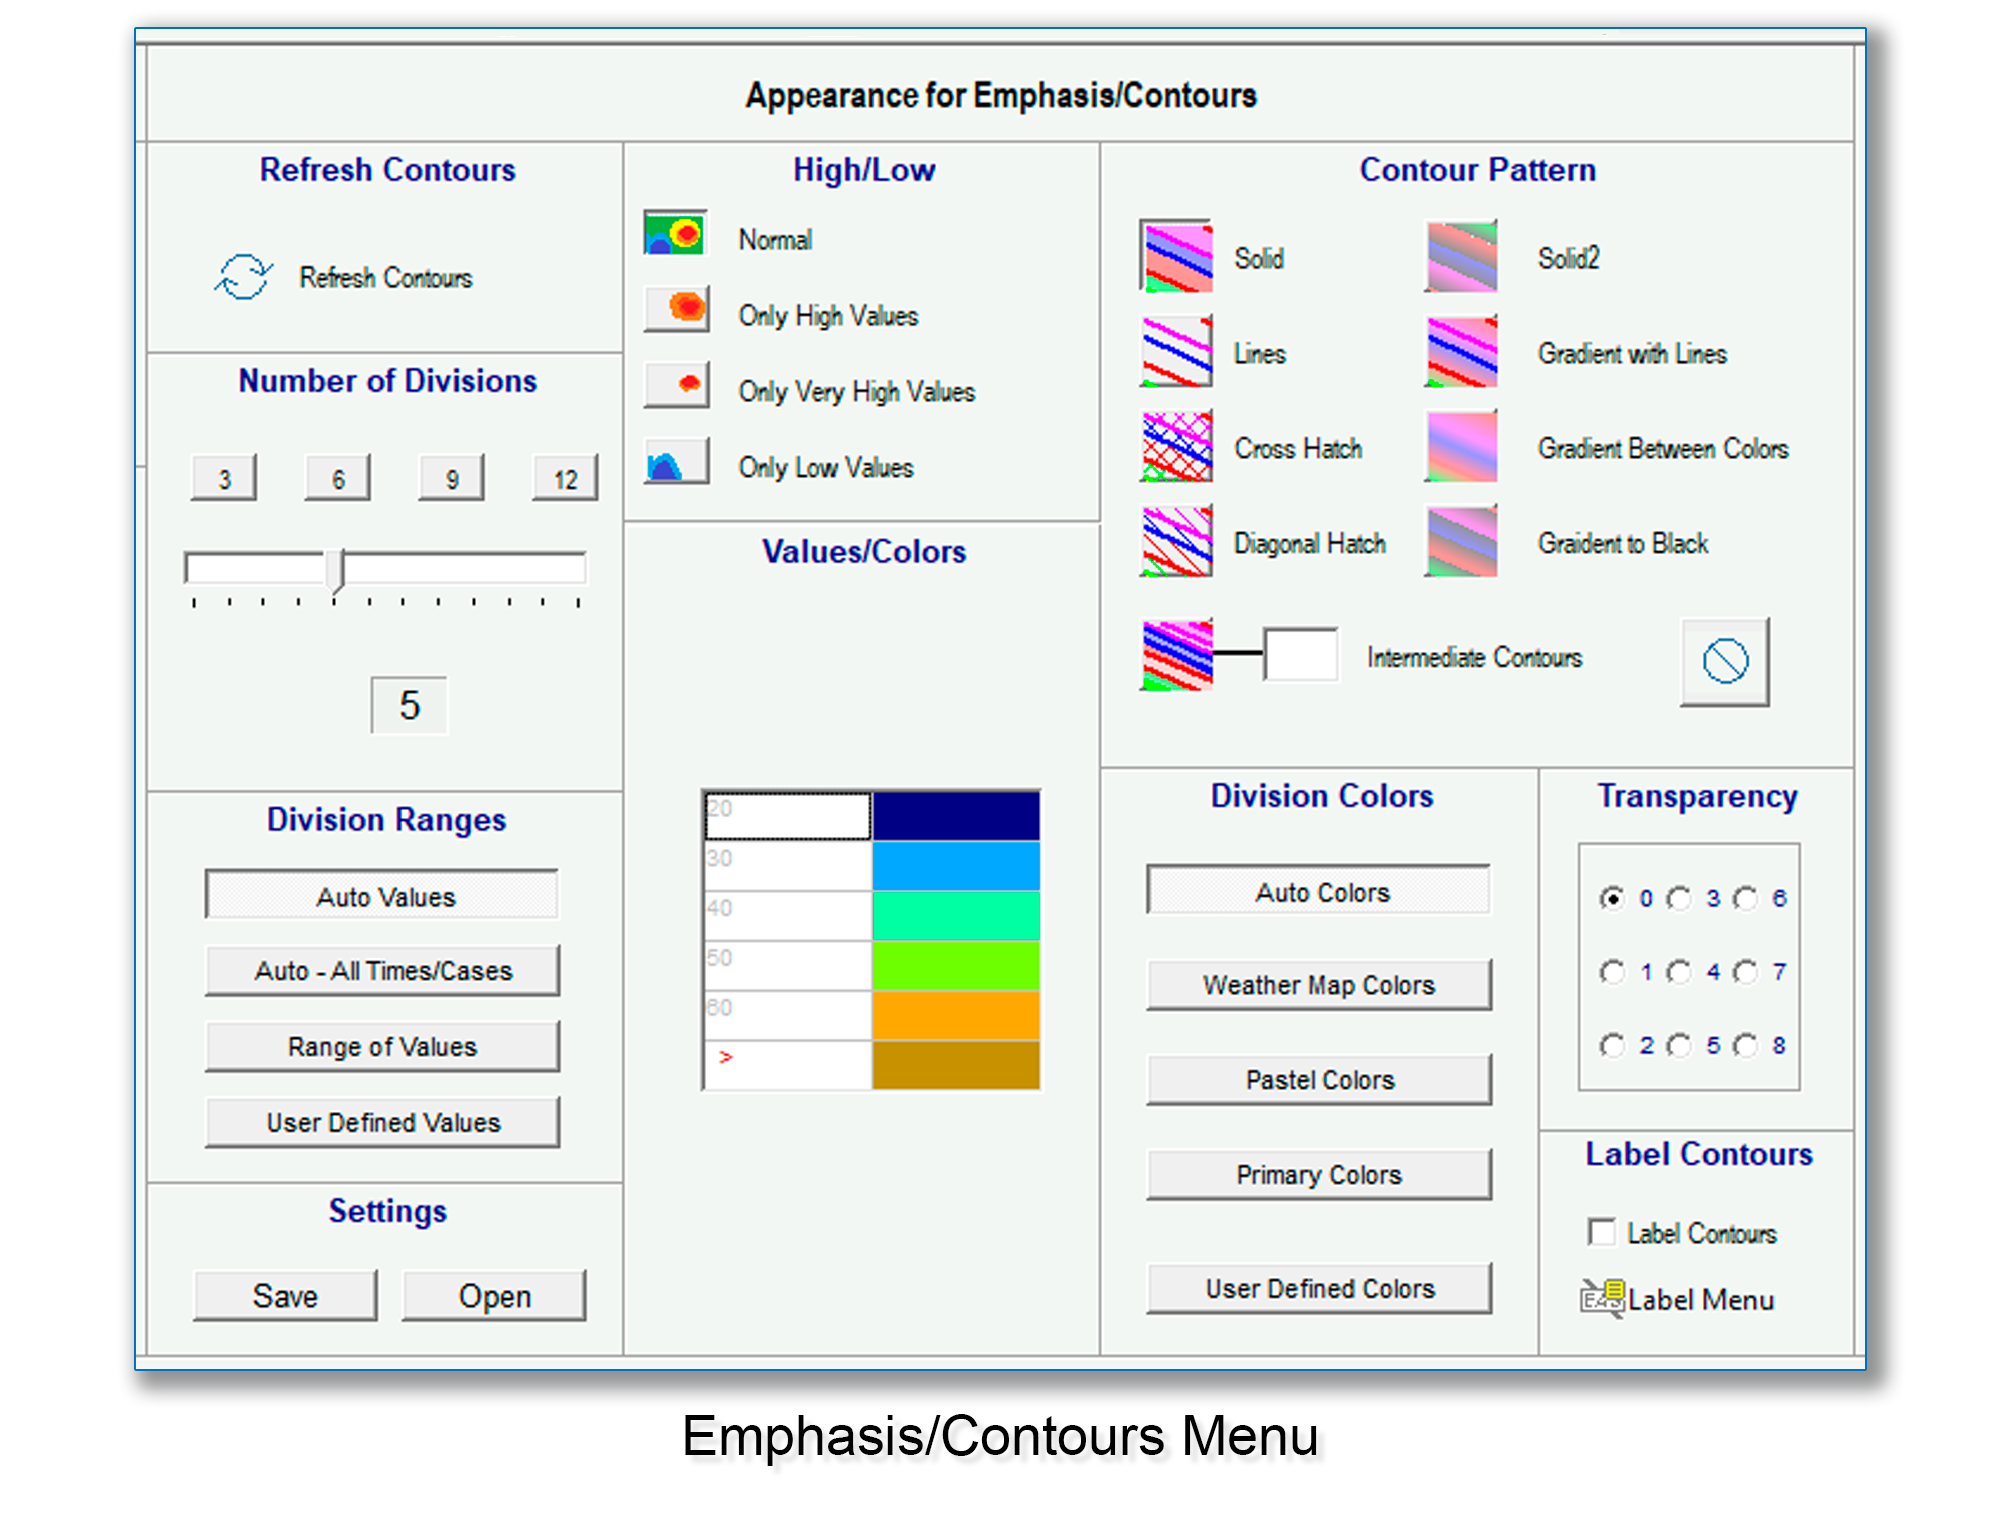
Enhanced Contours: Allow the user to enhance contours by offering additional lightness settings, high and low values, and enriched intermediate contours.
Color-Code Nodes and Pipes: Results and other parameters may be emphasized by color coding nodes or pipes. User-assigned attributes can also be emphasized for pipes, or contoured for nodes.
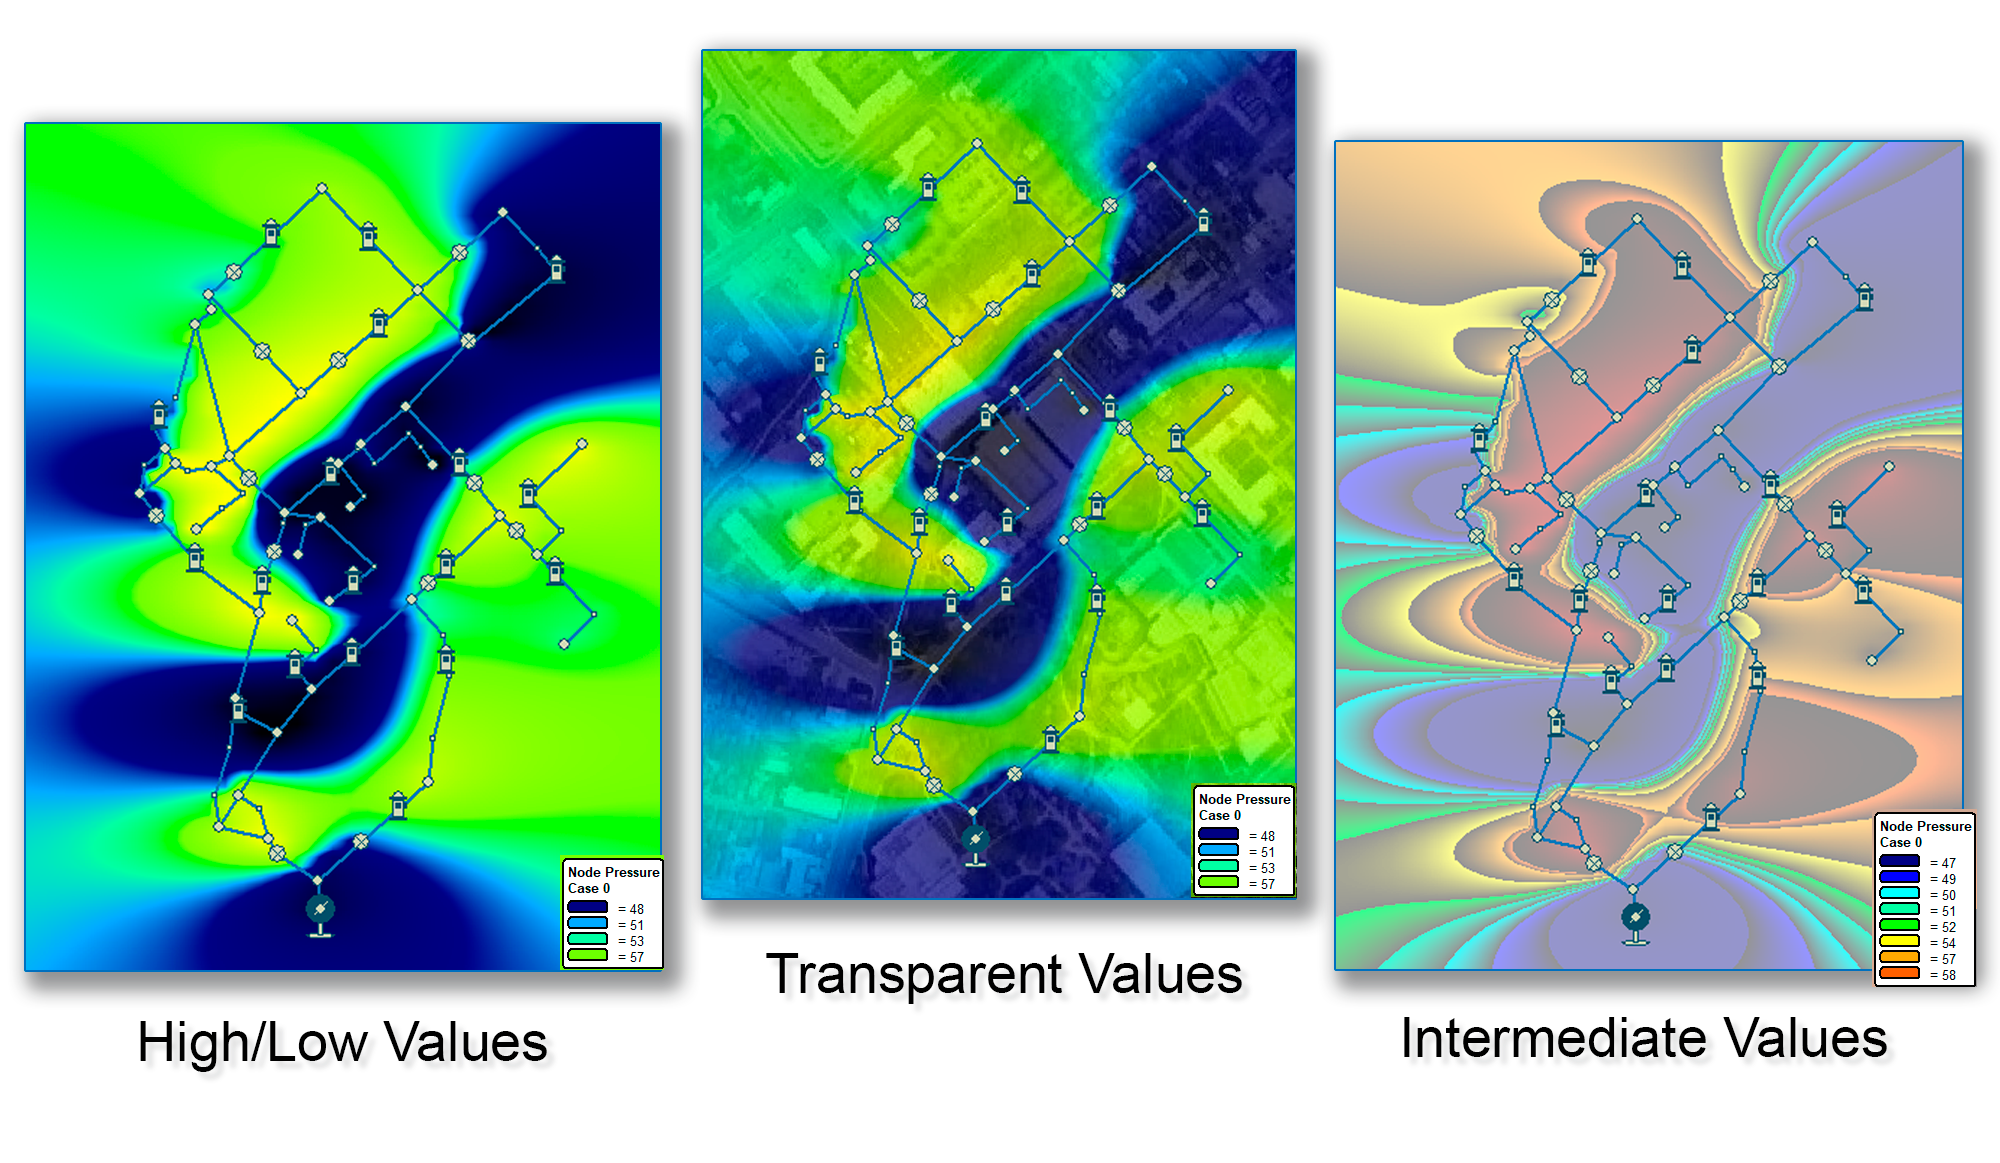
- Pipe Emphasis: Pipes can be emphasized with the same colors and values as nodes. In the first image below, node pressure contours are turned on but not pipe emphasis. In the second image, both contours and pipe emphasis are turned on.
2. Hydrant Color Coding: One example where the color-coding of nodes is useful is hydrant color coding: NFPA-color ratings can be assigned automatically based on fire flow analysis results.