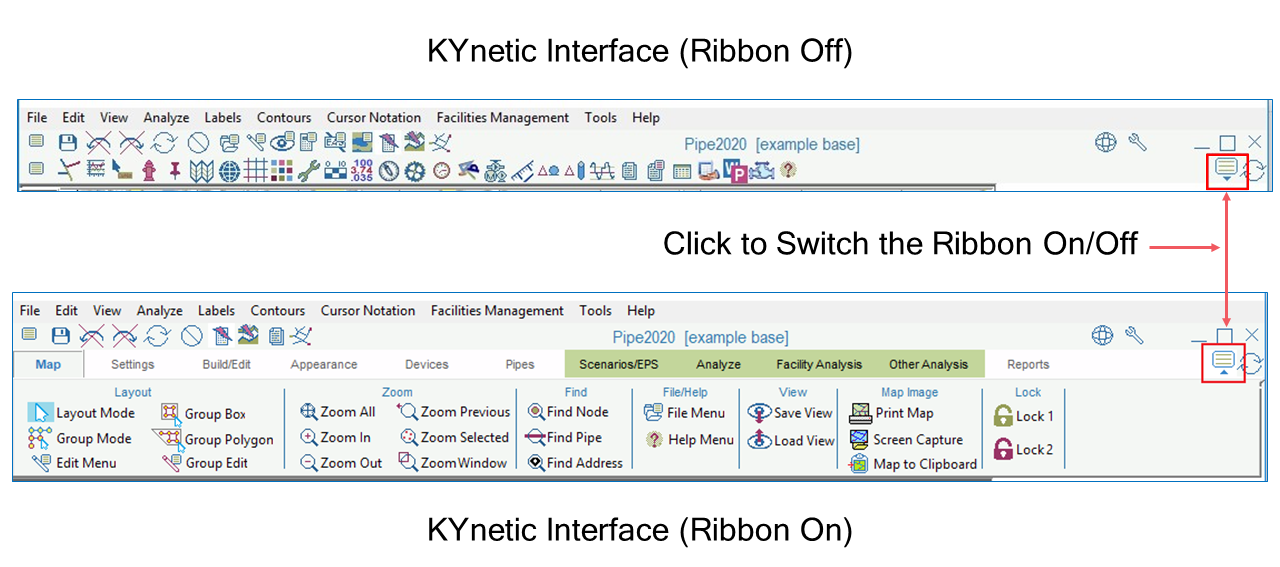
As of the Pipe2020 Release, the KYnetic program interface now includes a collapsible Menu Ribbon. This ribbon organizes the features and data inputs of the program into intuitive groups, located in tabs. Now, all map-related functions are under the Map Tab, and functions related to devices (i.e., nodes) are under a Device Tab, etc., allowing easier navigation. Further, text descriptions have been added to the Ribbon Tabs and the individual menu buttons/icons within each tab. Both the Ribbon Menu and the original KYnetic Menu are now displayed in a softer color palette.
This image shows how to turn on (expand) and turn off (collapse) the Ribbon.

1. Expand/Collapse the KYnetic Ribbon
There are four Ribbon Tabs related to analysis setup and running an analysis; these are now located in a common area, and are shaded green to distinguish them from bordering tabs:
2. Tabs Used to Setup and Run an Analysis
The content of the tabs changes depending on the analysis engine currently in use (KYPipe, Surge, Gas/Steam, etc.), with the exception of the Map Tab. Below are examples of the contents of the tabs:
3. Map Tab (All Analysis Engines)
4. Settings Tab (Surge)
5. Devices Tab (KYPipe)
5. Scenarios/EPS Tab (KYPipe)
6. Reports Tab (Surge)
KYPipe’s first GUI was the Classic Interface released in 2000. This was followed by the KYnetic Interface released in 2012. Some features are only available with the KYnetic Interface (with or without the Ribbon expanded) as opposed to the Classic Interface. Classic users can however switch back and forth between the two interfaces as needed. Click here for a list of KYnetic-only features.


