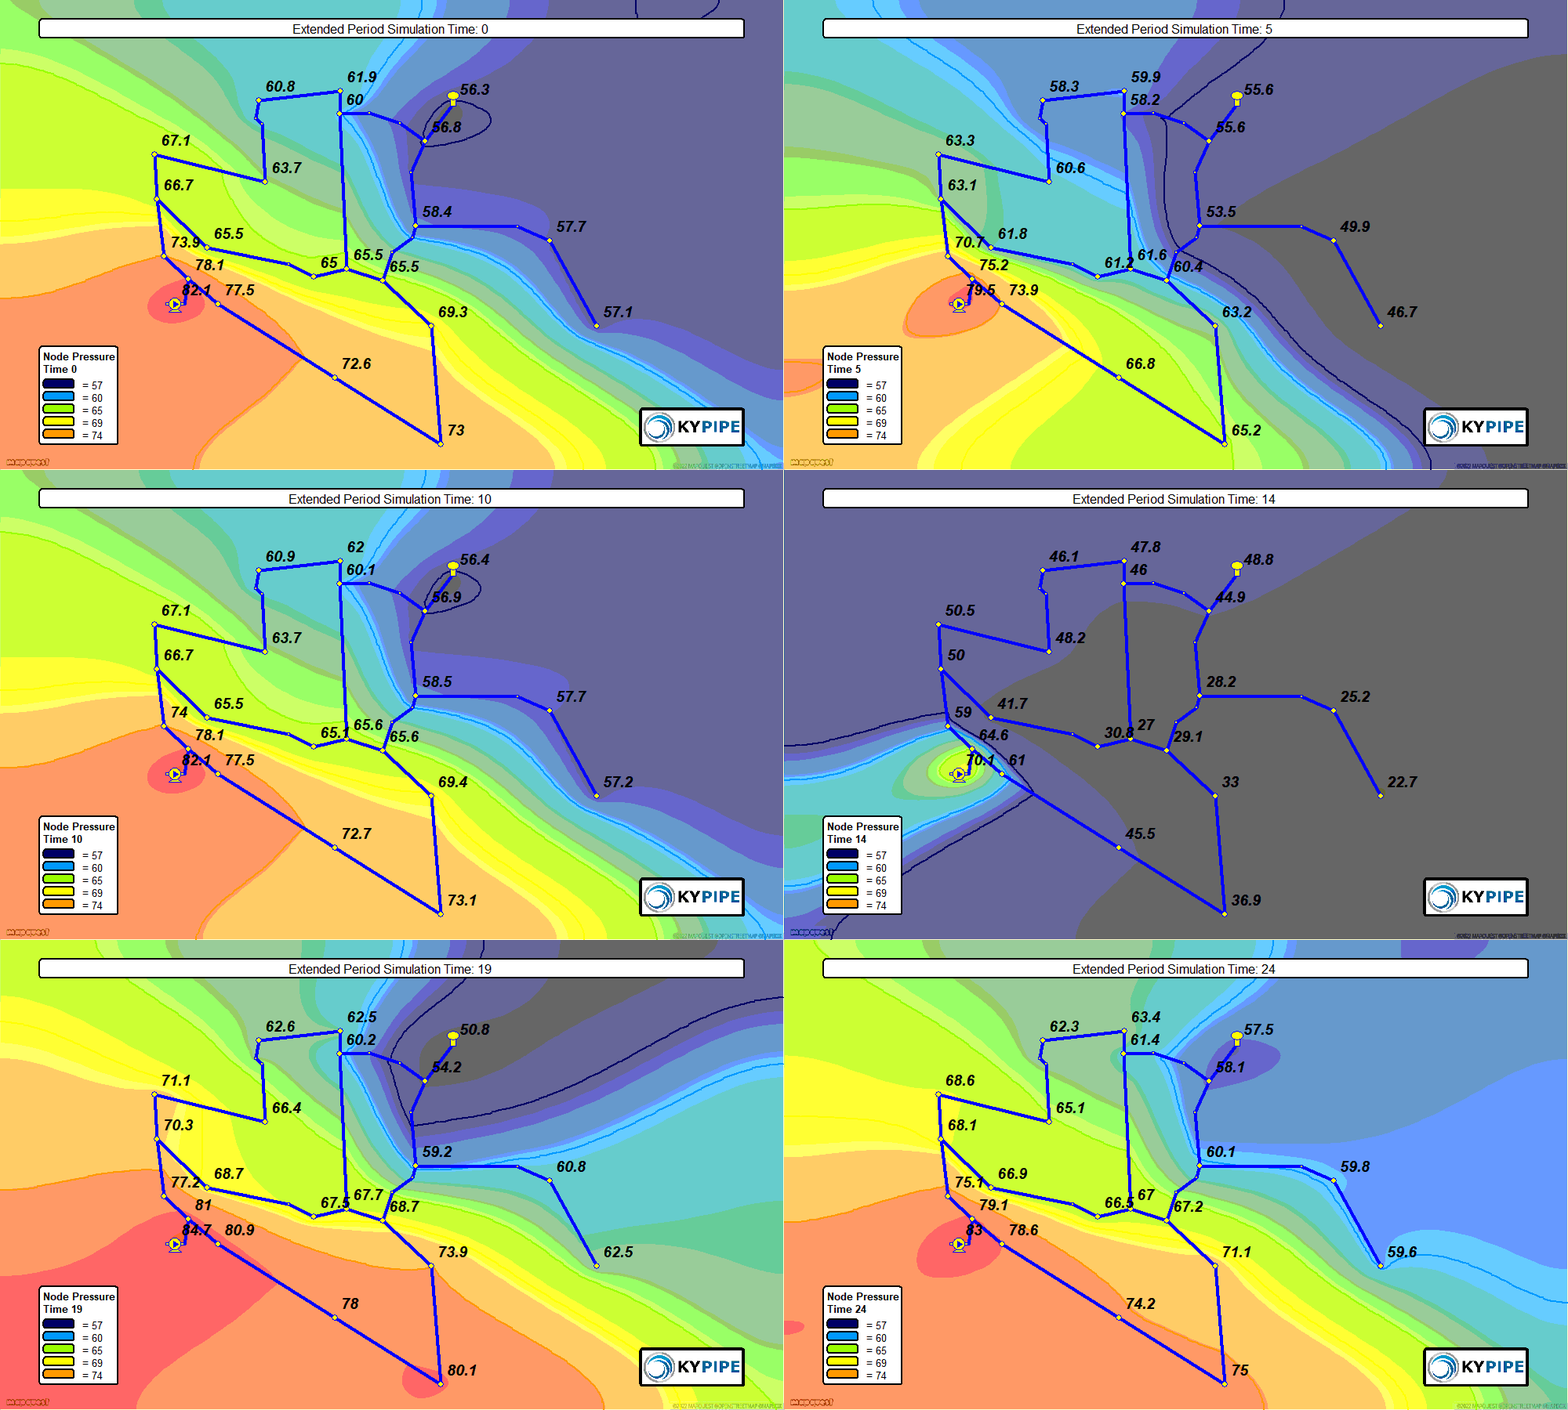
Stunning visual presentations can be created with animated contours. Contours can be created for different variables, including node pressure, head, and demand, among others. This feature animates the changes in these variables over time. In addition, pipes and nodes can be emphasized using the same color scale used to create contours. This allows for a visual display of pipe flow and velocity, among other variables. Results can be shown at different times, for example, pressure contours for time 7.5 can be displayed simultaneously with the color emphasis of node demands at time 7.5 and color emphasis of pipe flows at time 10.25. AVI, Animated GIF and MP4 files can also be created of these animations.


