
-
The Pipe Ratings Exceedance feature combines several tools that help users to determine if pressures within the pipes in the model exceed their manufacturer’s pressure rating, at any point in the simulation. View more details at this link (Pipe Ratings Exceedance feature). These tools include:
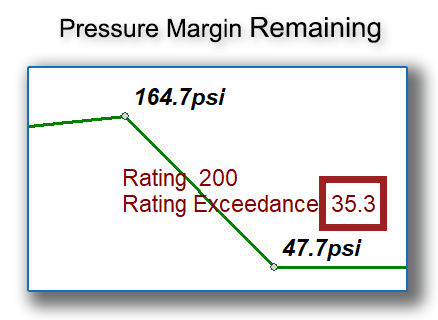
1. Labels in the Map Area. These labels show the pipe pressure rating, and the amount by which the pipe pressure rating was exceeded. In the image shown below, a positive value for the rating exceedance indicates that the pipe has this much margin before its pressure rating is exceeded. The margin is 35.3 psi (200 -164.7 = 35.3 psi)).
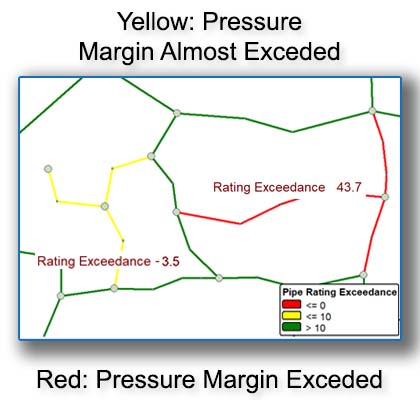
2. Pipe Emphasis. The Pipe Emphasis tool uses a color-coded key to show which pipes exceed their pressure rating, and which pipes are flagged as cautionary – that is, they are within 10 psi of their pressure rating, but they have not yet exceeded the pressure rating. Pipes which have exceeded their rating are shown in red, and pipes with a cautionary warning are shown in yellow. Pipes which have not exceeded their pressure rating are shown in green. Units are psi:
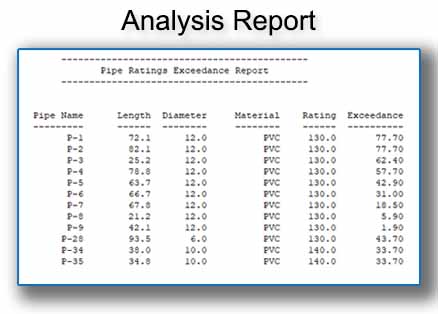
3. Analysis Report. The Analysis Report lists all pipes that have exceeded their pressure rating, along with the pipe’s physical characteristics, and the amount by which the pressure rating was exceeded, in units of psi.
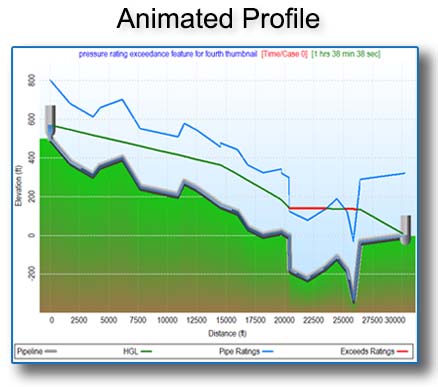
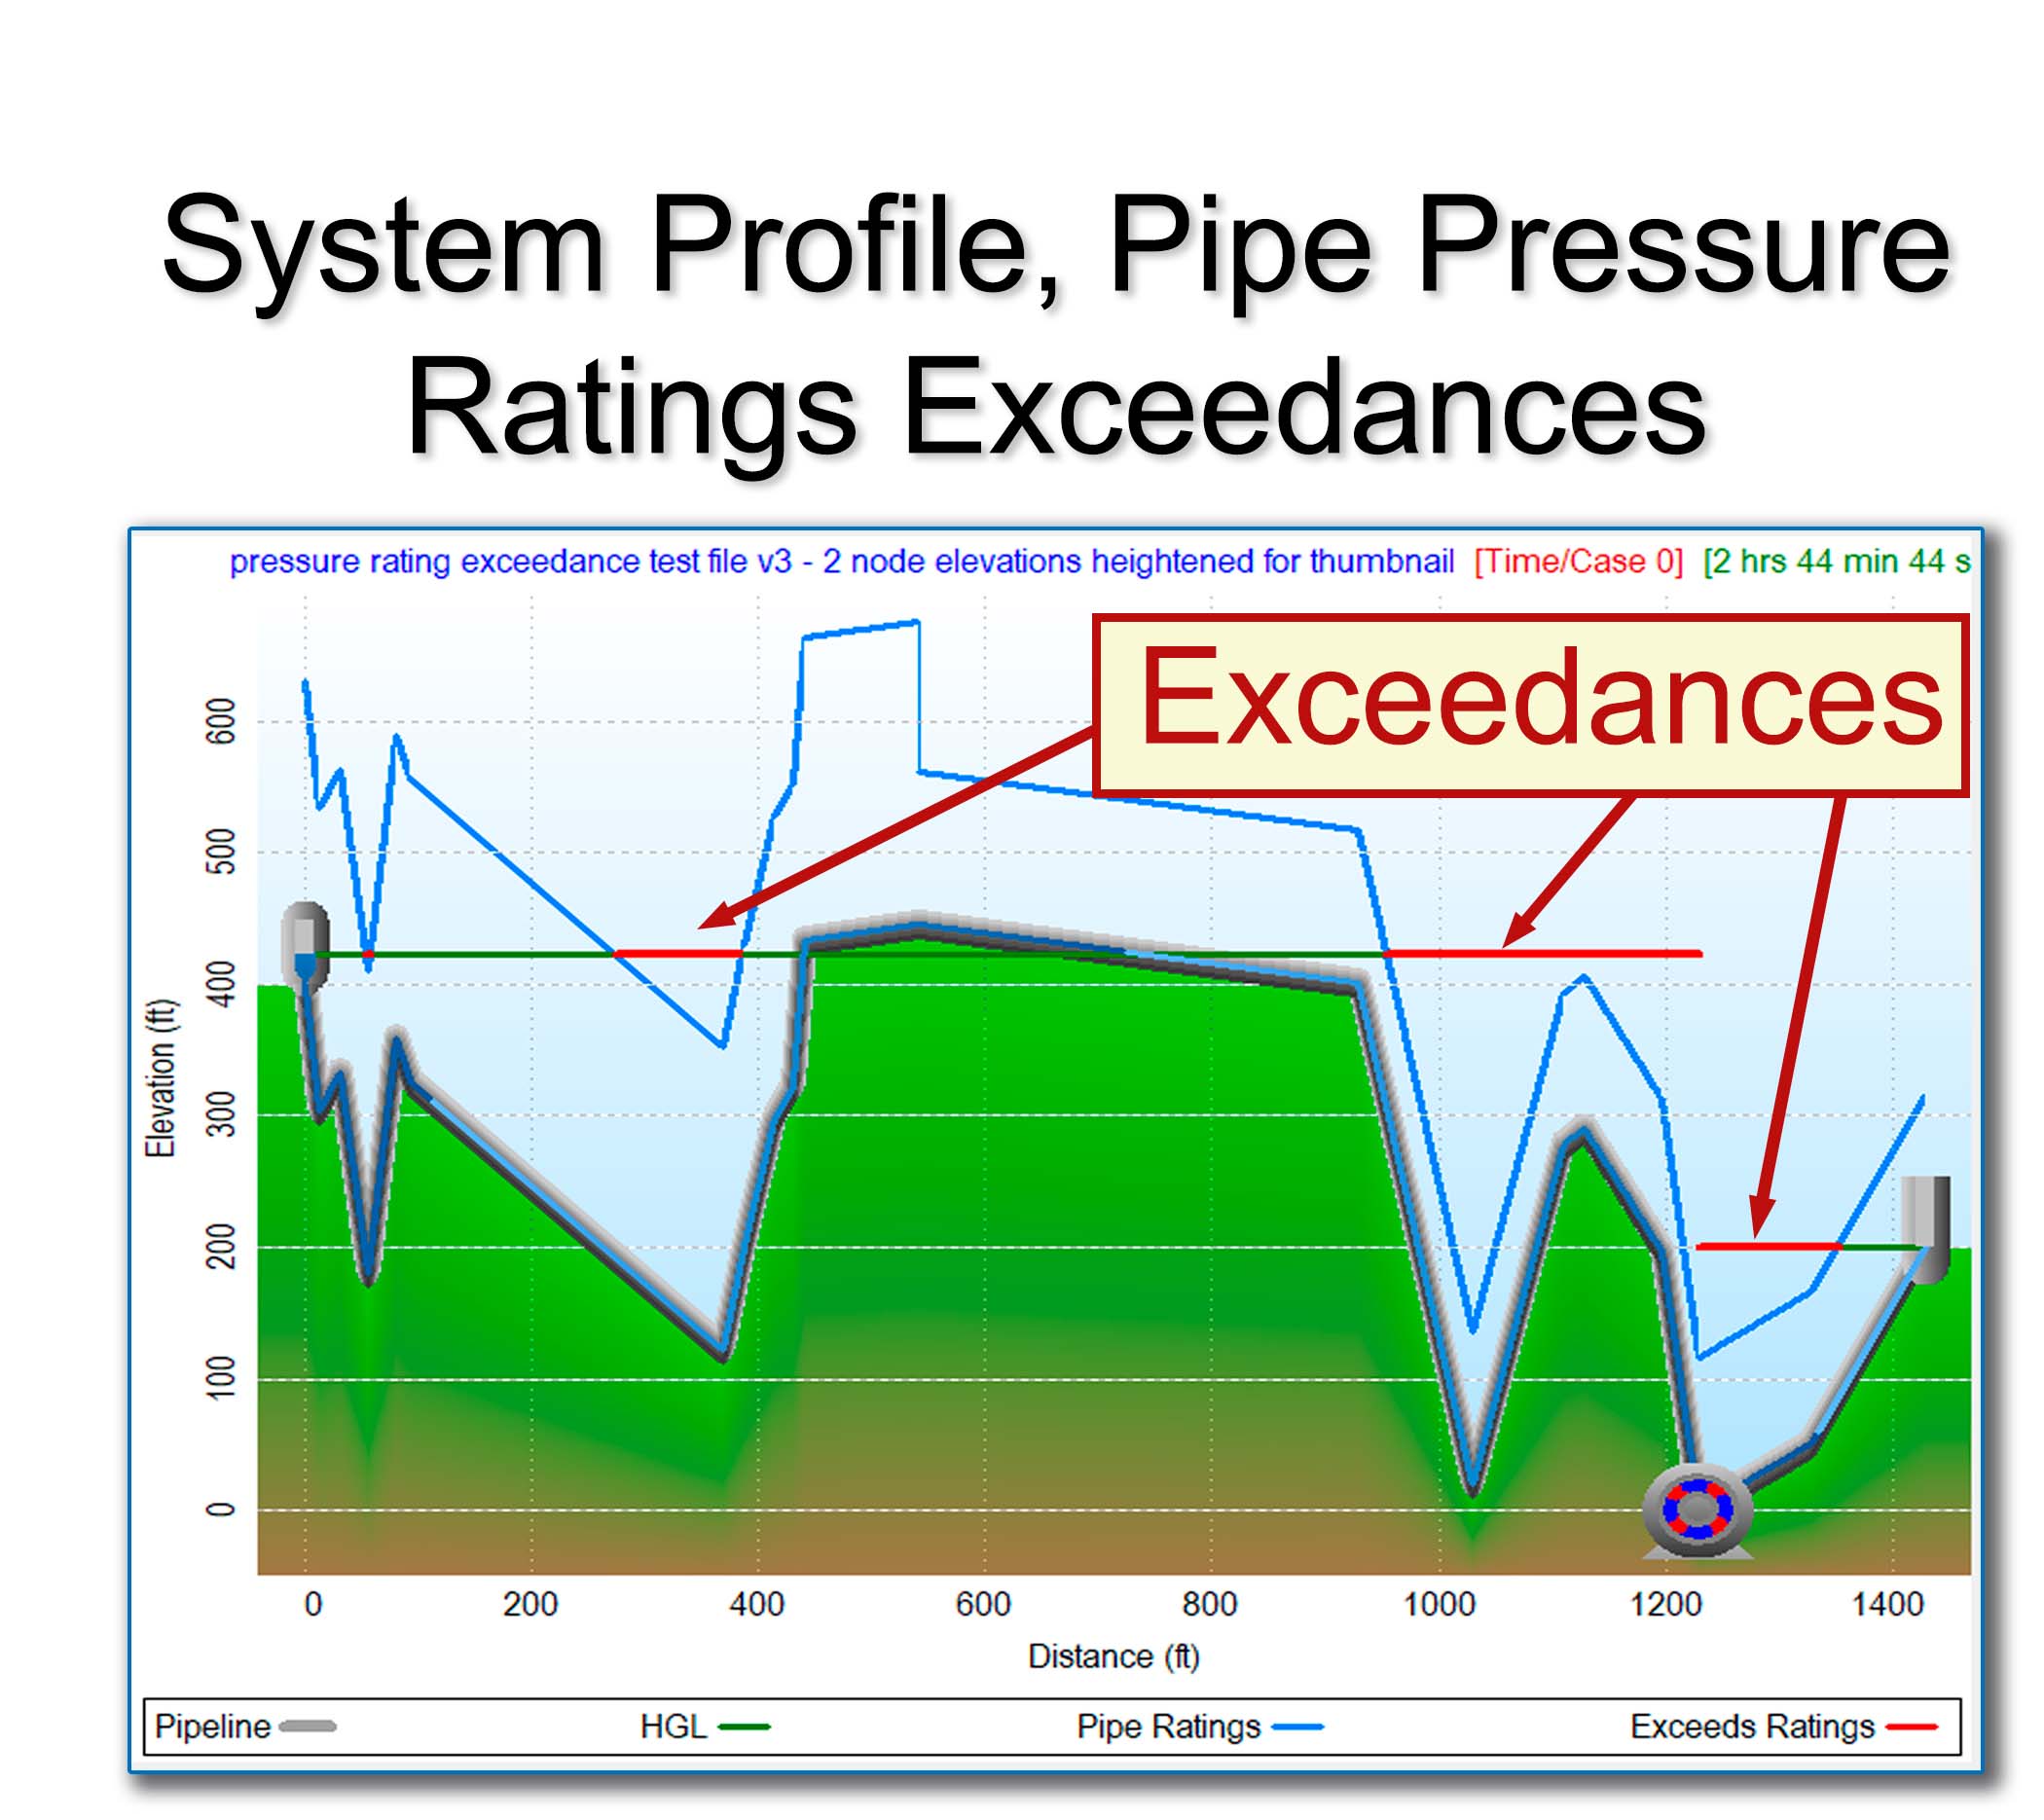
4. Animated Profile. The creates an Animated Profile with the pipe pressure rating graphed as a head value line, along with the pressure within the pipes of the model graphed as an HGL line: Wherever the HGL line of the model’s pressures rises above the pipe’s pressure rating line, that pipe’s pressure rating has been exceeded, and the pipe is displyed using a red color, see the image below. Units are feet of head:
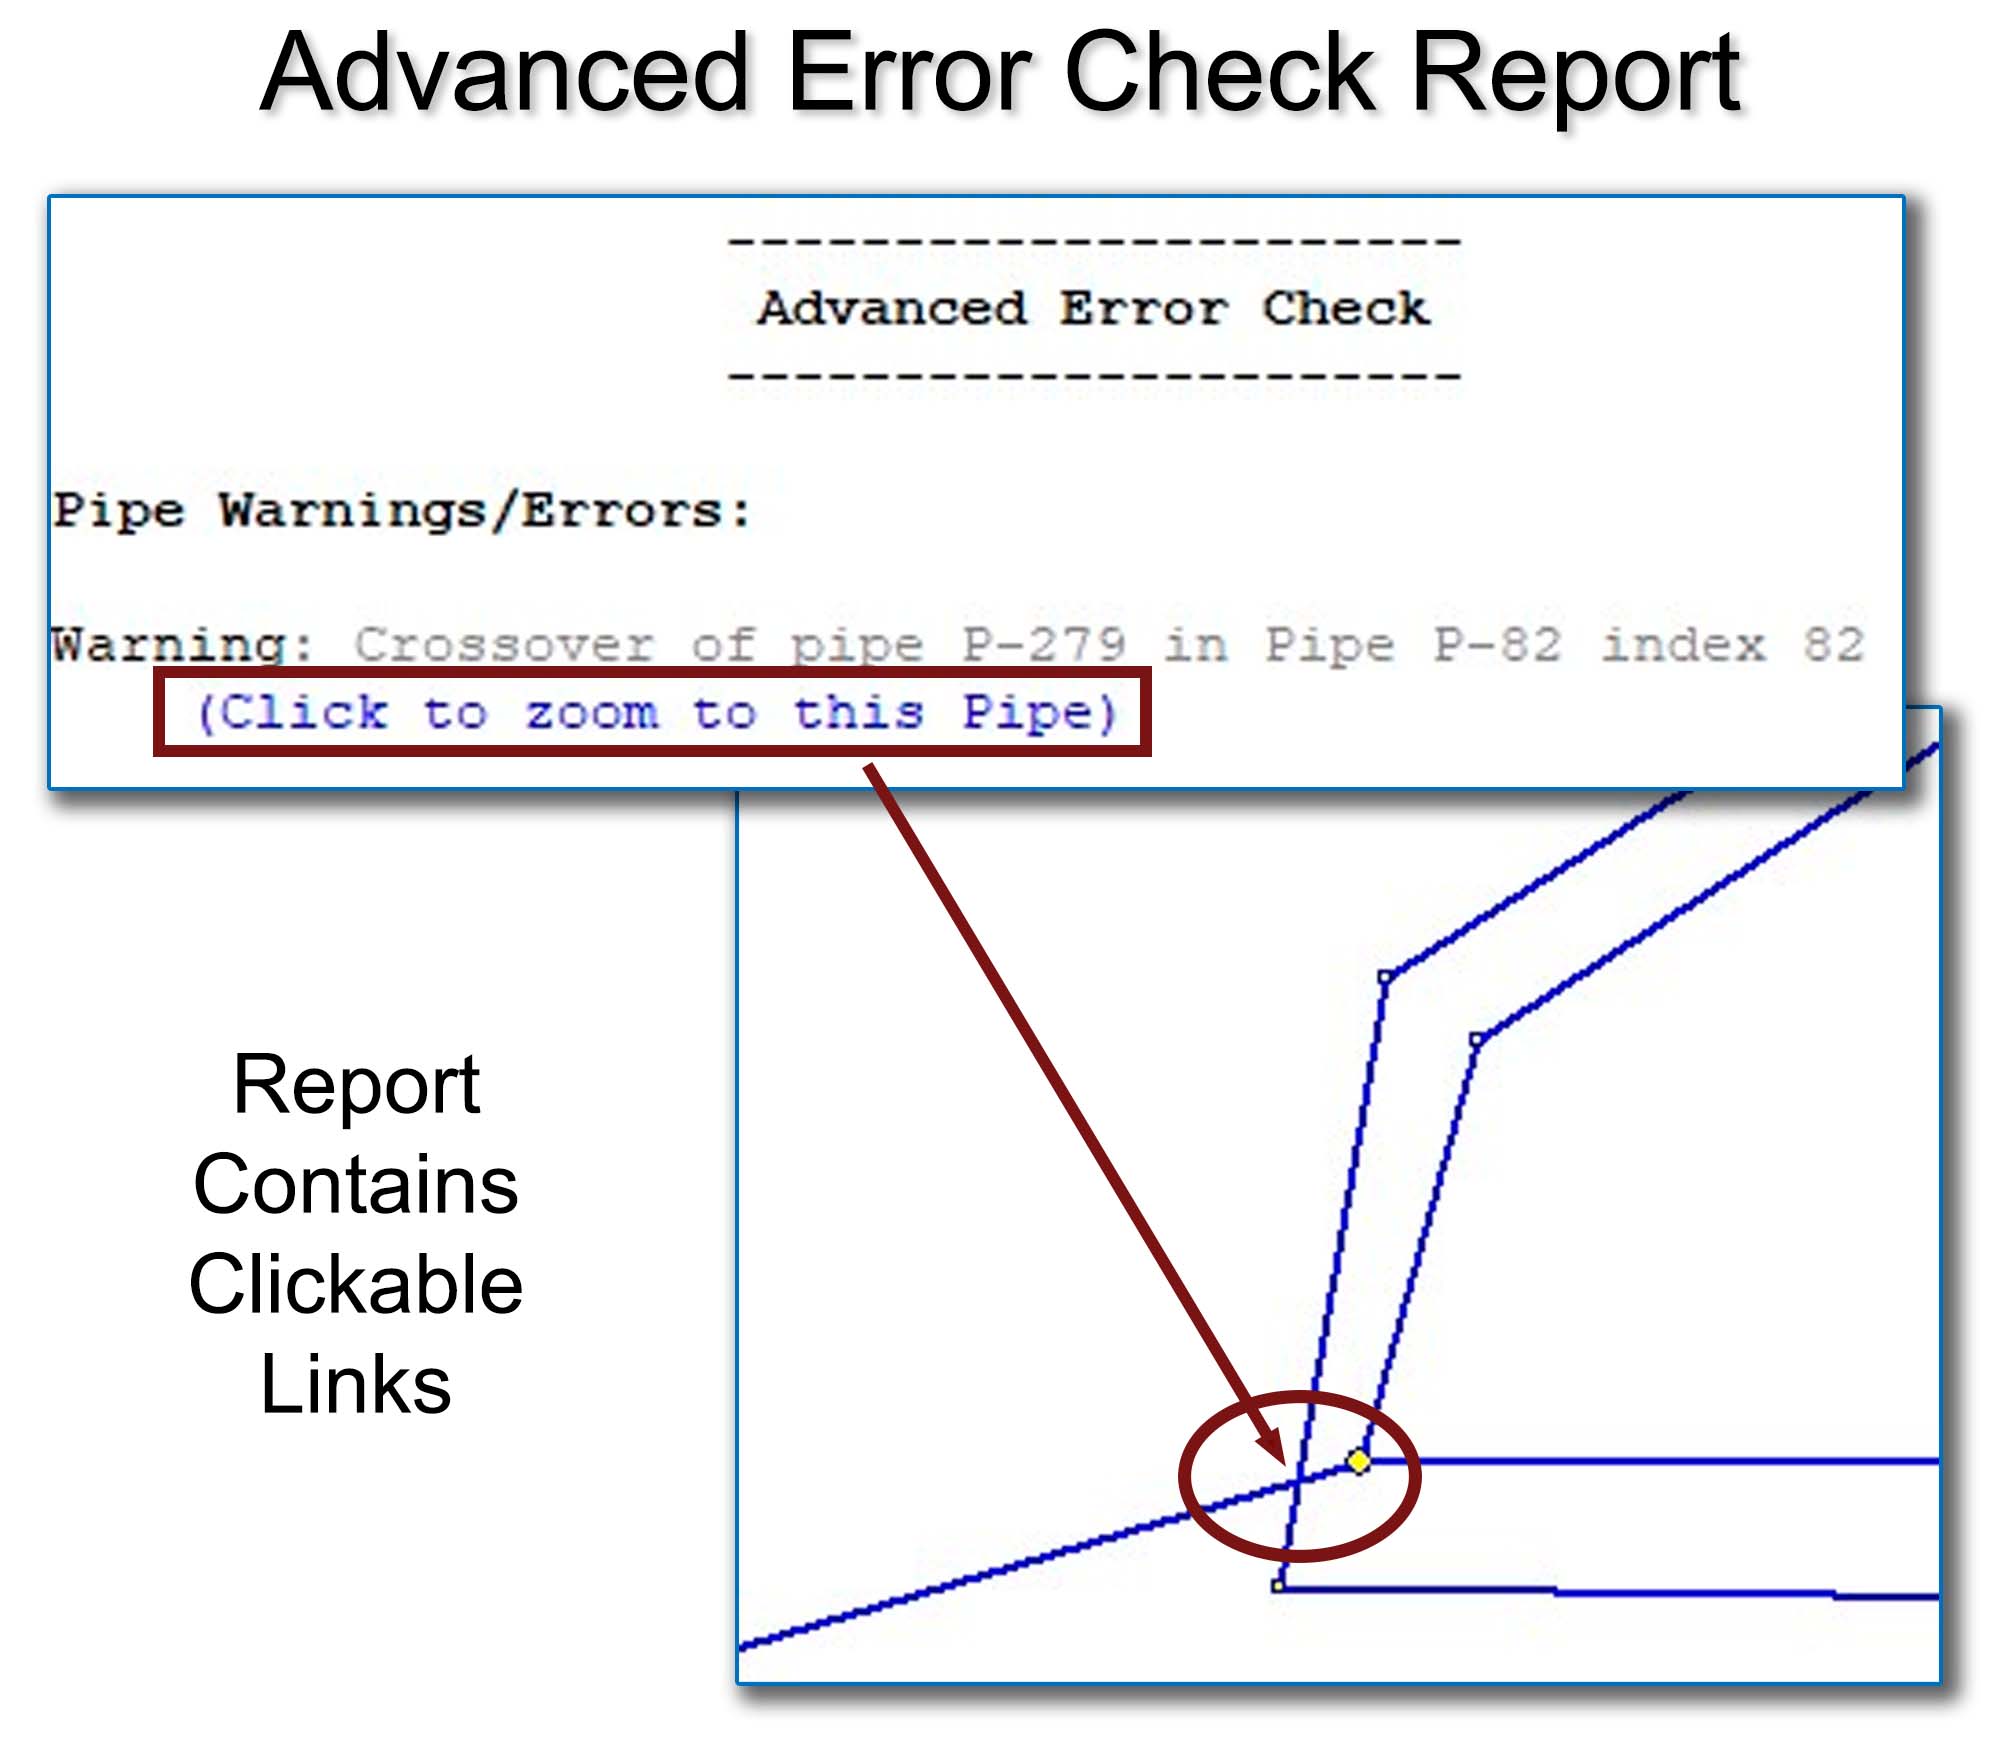
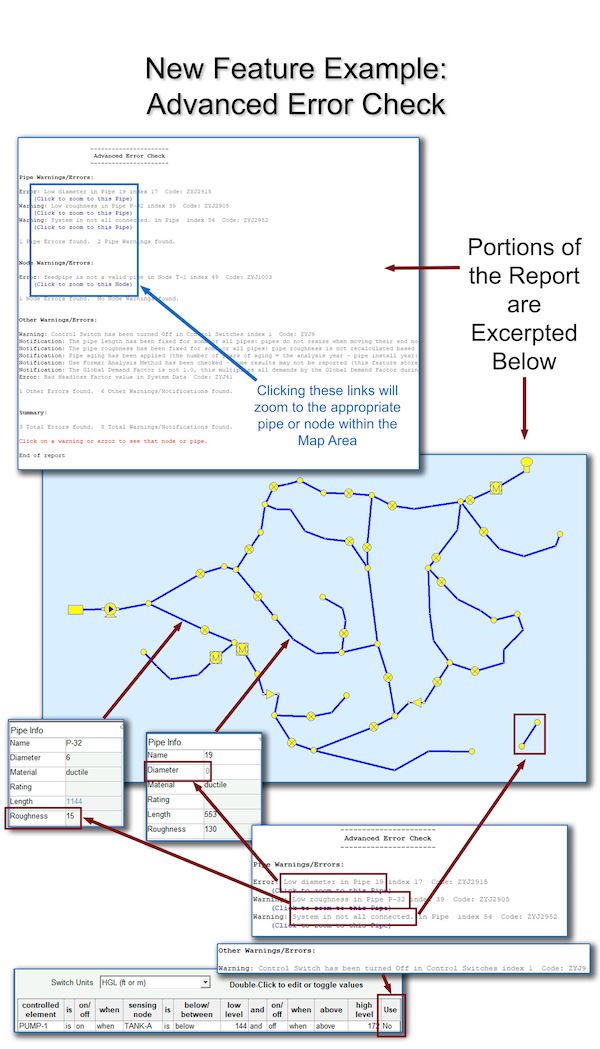
Advanced Error Check Feature. This feature creates a centralized list of Notifications, Error Messages and Warning Messages compiled from decades of technical support and model troubleshooting experience, reporting critical errors, as well as common input errors (warnings) and settings changes (notifications) that may not be immediately apparent when the model is analyzed.
This list can be generated before an Analysis has been run, placing the user just one click away from the List of Errors/Warnings before conductiong the analysis. Clickable links are included in the Report which will zoom directly to the pipe or node of concern within the Map Area. See more here (Advanced Error Check).
Prior to Pipe2024, KYPipe incorporated a Total Inventory feature, which returned cost totals for the piping and devices within each model, along with an Inventory Report. The Inventory Report included summaries of Total Pipe Volume, a Fittings Summary and Fittings Cost(s).
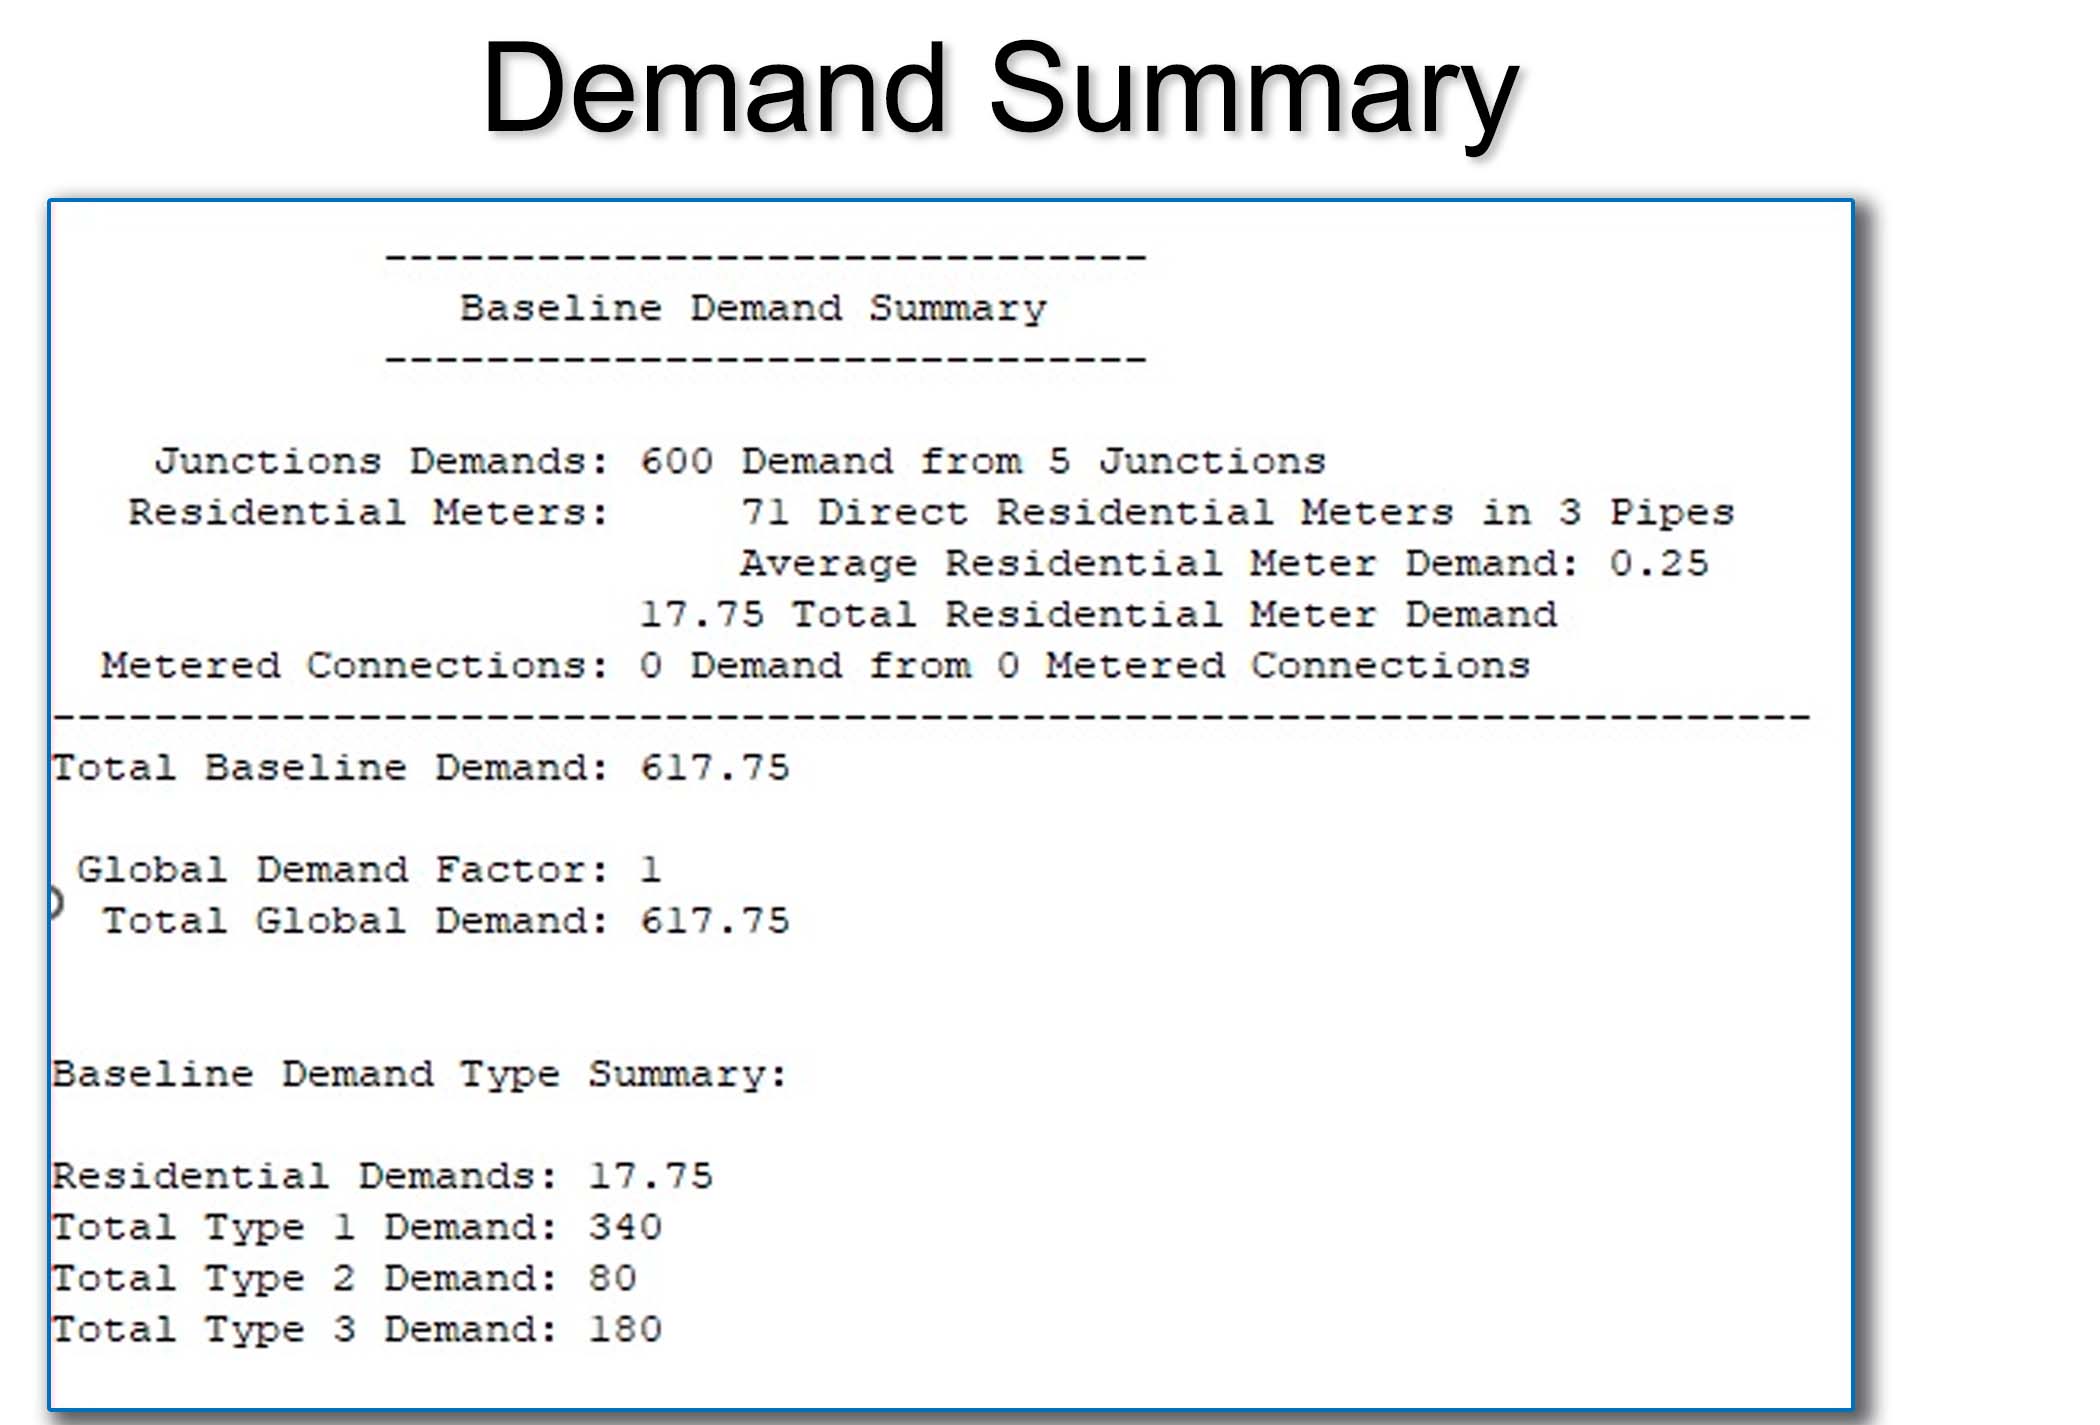
For Pipe2024, we have added a Demand Summary to the above features. The Demand Summary calculates the total demands present in the model, but also breaks down the demands by device type (Junction Demands, Residential Meters in pipes, and Metered Connection Nodes), and by Demand Type (e.g., R (Residential), Type 1, Type 2, Type 3, etc.).
The Demand Summary also returns the current Global Demand Factor (which is normally 1.0 for average demands, > 1.0 for peak demands, and < 1.0 for slack demands).
Last, this new feature incorporates a Device Summary which returns the total numbers of different devices (pumps, valves, tanks, etc.) in the model.
-

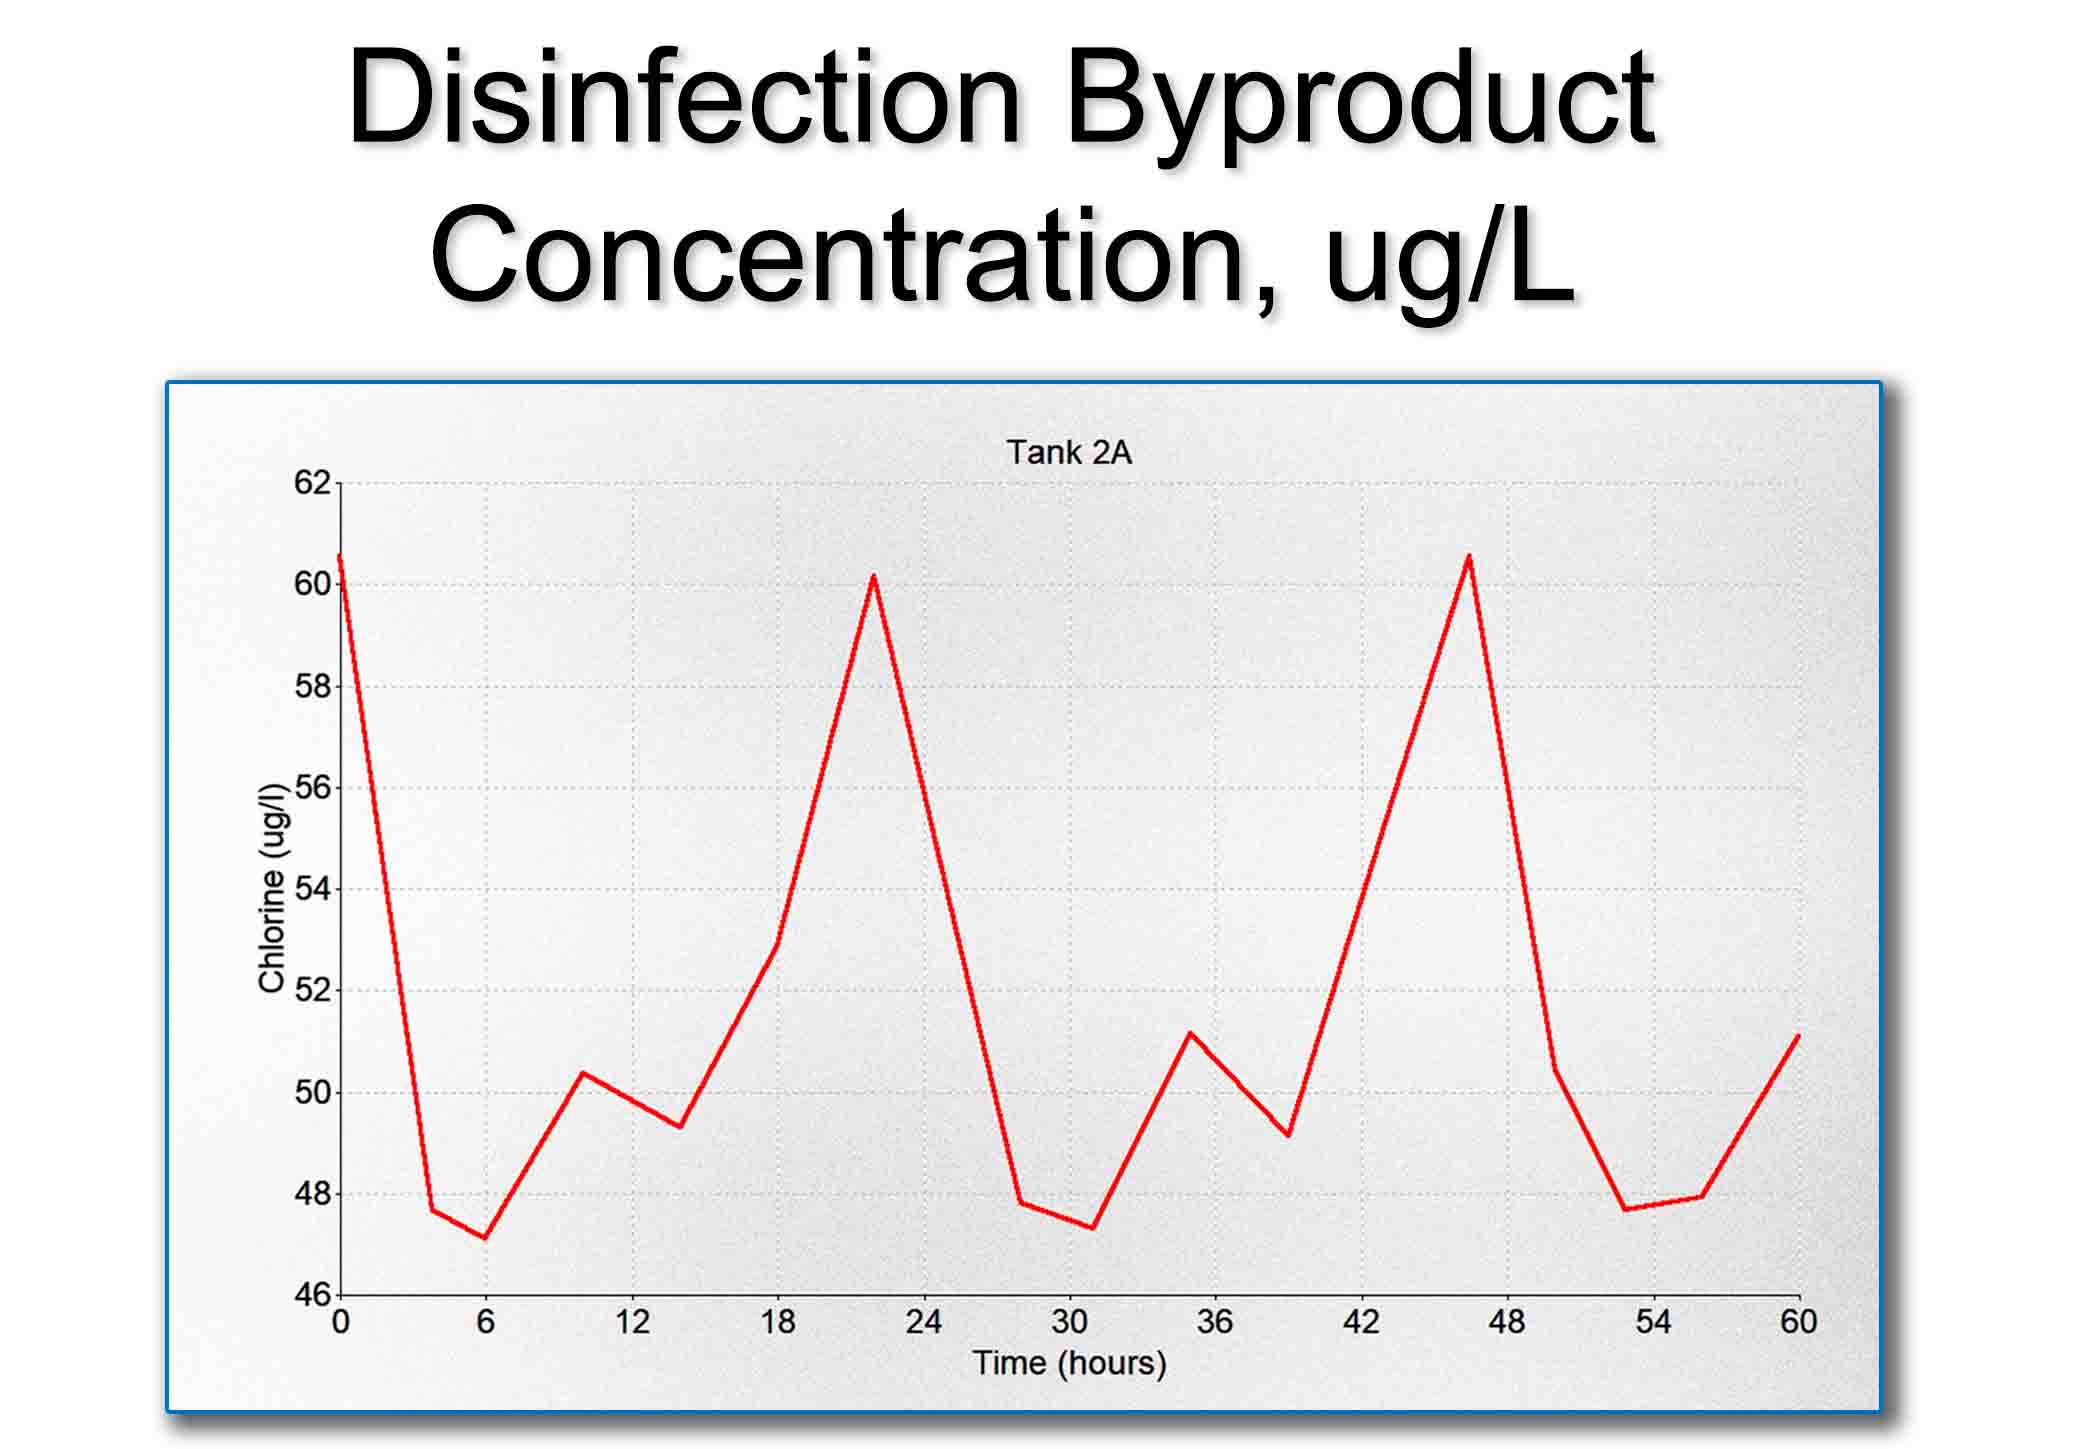
This feature allows users to calculate concentrations of disinfectant byproducts (DBPs) within a regular KYPipe Water Quality model.
First, users select the analysis type, Chemical Concentration or Water Age.
For tanks and reservoir nodes, the user inputs the initial chlorine concentration directly. For other point sources (Node Source Data), there are 4 different options to specify the chlorine levels – concentration, mass, flow-paced and set point. These values are converted into chlorine levels in mg/l.
For all three types of nodes (tanks, reservoirs, and point sources), the software accommodates alterations to the source concentration levels based on the pattern data.
For concentration-based analyses, the chlorine demand X at any point/time in the model is calculated by determining the average concentration of the chlorine residual at all sources (nodes), and then subtracting the calculated chlorine concentration at each individual node within the model.
For Water Age-based DBP calculations, the Water Age is calculated at each individual node within the model throughout the course of the simulation.
Learn more here (DBPs).
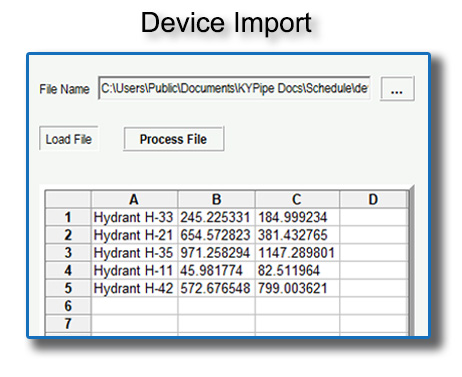
Import Demands and Devices from an External File. Users can import demands or other devices by Lat/Long, X,Y location or Node Name from a Microsoft Excel file. Users specify the device type (or simply specify “demands”), and specify which columns in the text file contain the location data (i.e., Columns B and C, above). Devices can include:
- Demands (as applied to junction nodes).
- Hydrants.
- Valves.
- Number of Residential Meters (which are applied within pipes).
Last, users specify which column of the spreadsheet contains device-specific information; this can include:
- Node Name.
- Demand in gpm (from junction nodes).
- Address (for residential meters).
- The average demand for all residential meters in the model (multiply this times the number of residential meters to get the sum of the demands attributed to pipes).
In some cases, the option is given to clear out old devices from the model (such as for junction demands or residential meters).
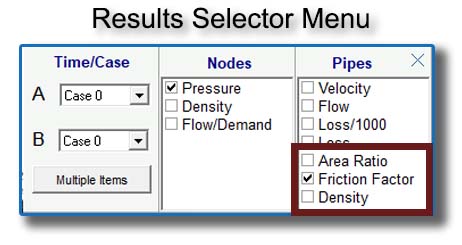
Pipe labels for KYPipe: Gas have previously included Flow, Mean Flow Velocity, Pressure Loss, and Pressure Loss per 1000 feet or meters of pipe; in 2024, KYPipe: Gas adds labels for Pipe Area Ratio Density, Pipe Friction Factor, and Pipe Density.
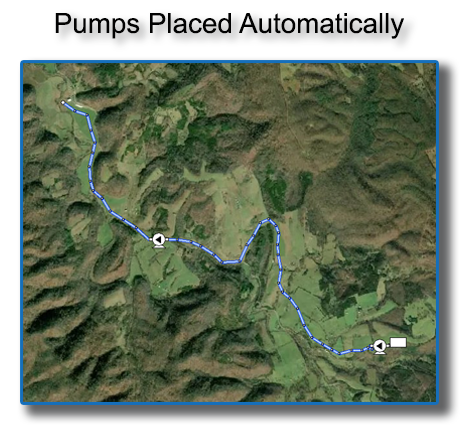
Optimal Pump Placement Tool. This Tool selects fom a user-supplied list of availabe pumps, and generates the layout for a least-cost pump optimization plan along a single (unbranched) pipeline, considering the following factors for all available pump types:
- Pump curves.
- Unit cost.
- Number of each type of pump in inventory.
It then selects and places the optimum number of pumps along the pipeline, maintaining a user-required minimum flow rate as well as both user-designated minimum and maximum system pressures.
-
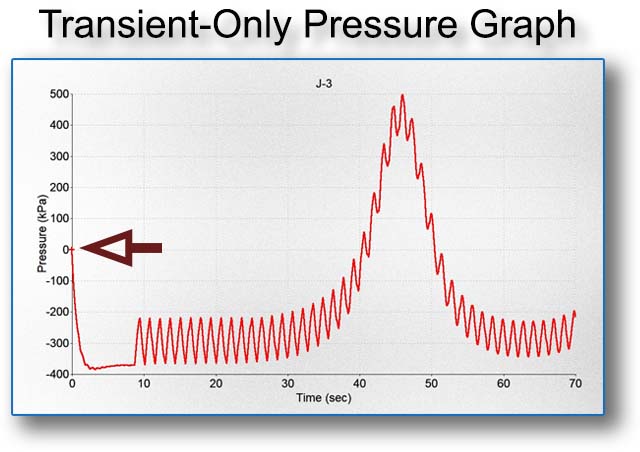
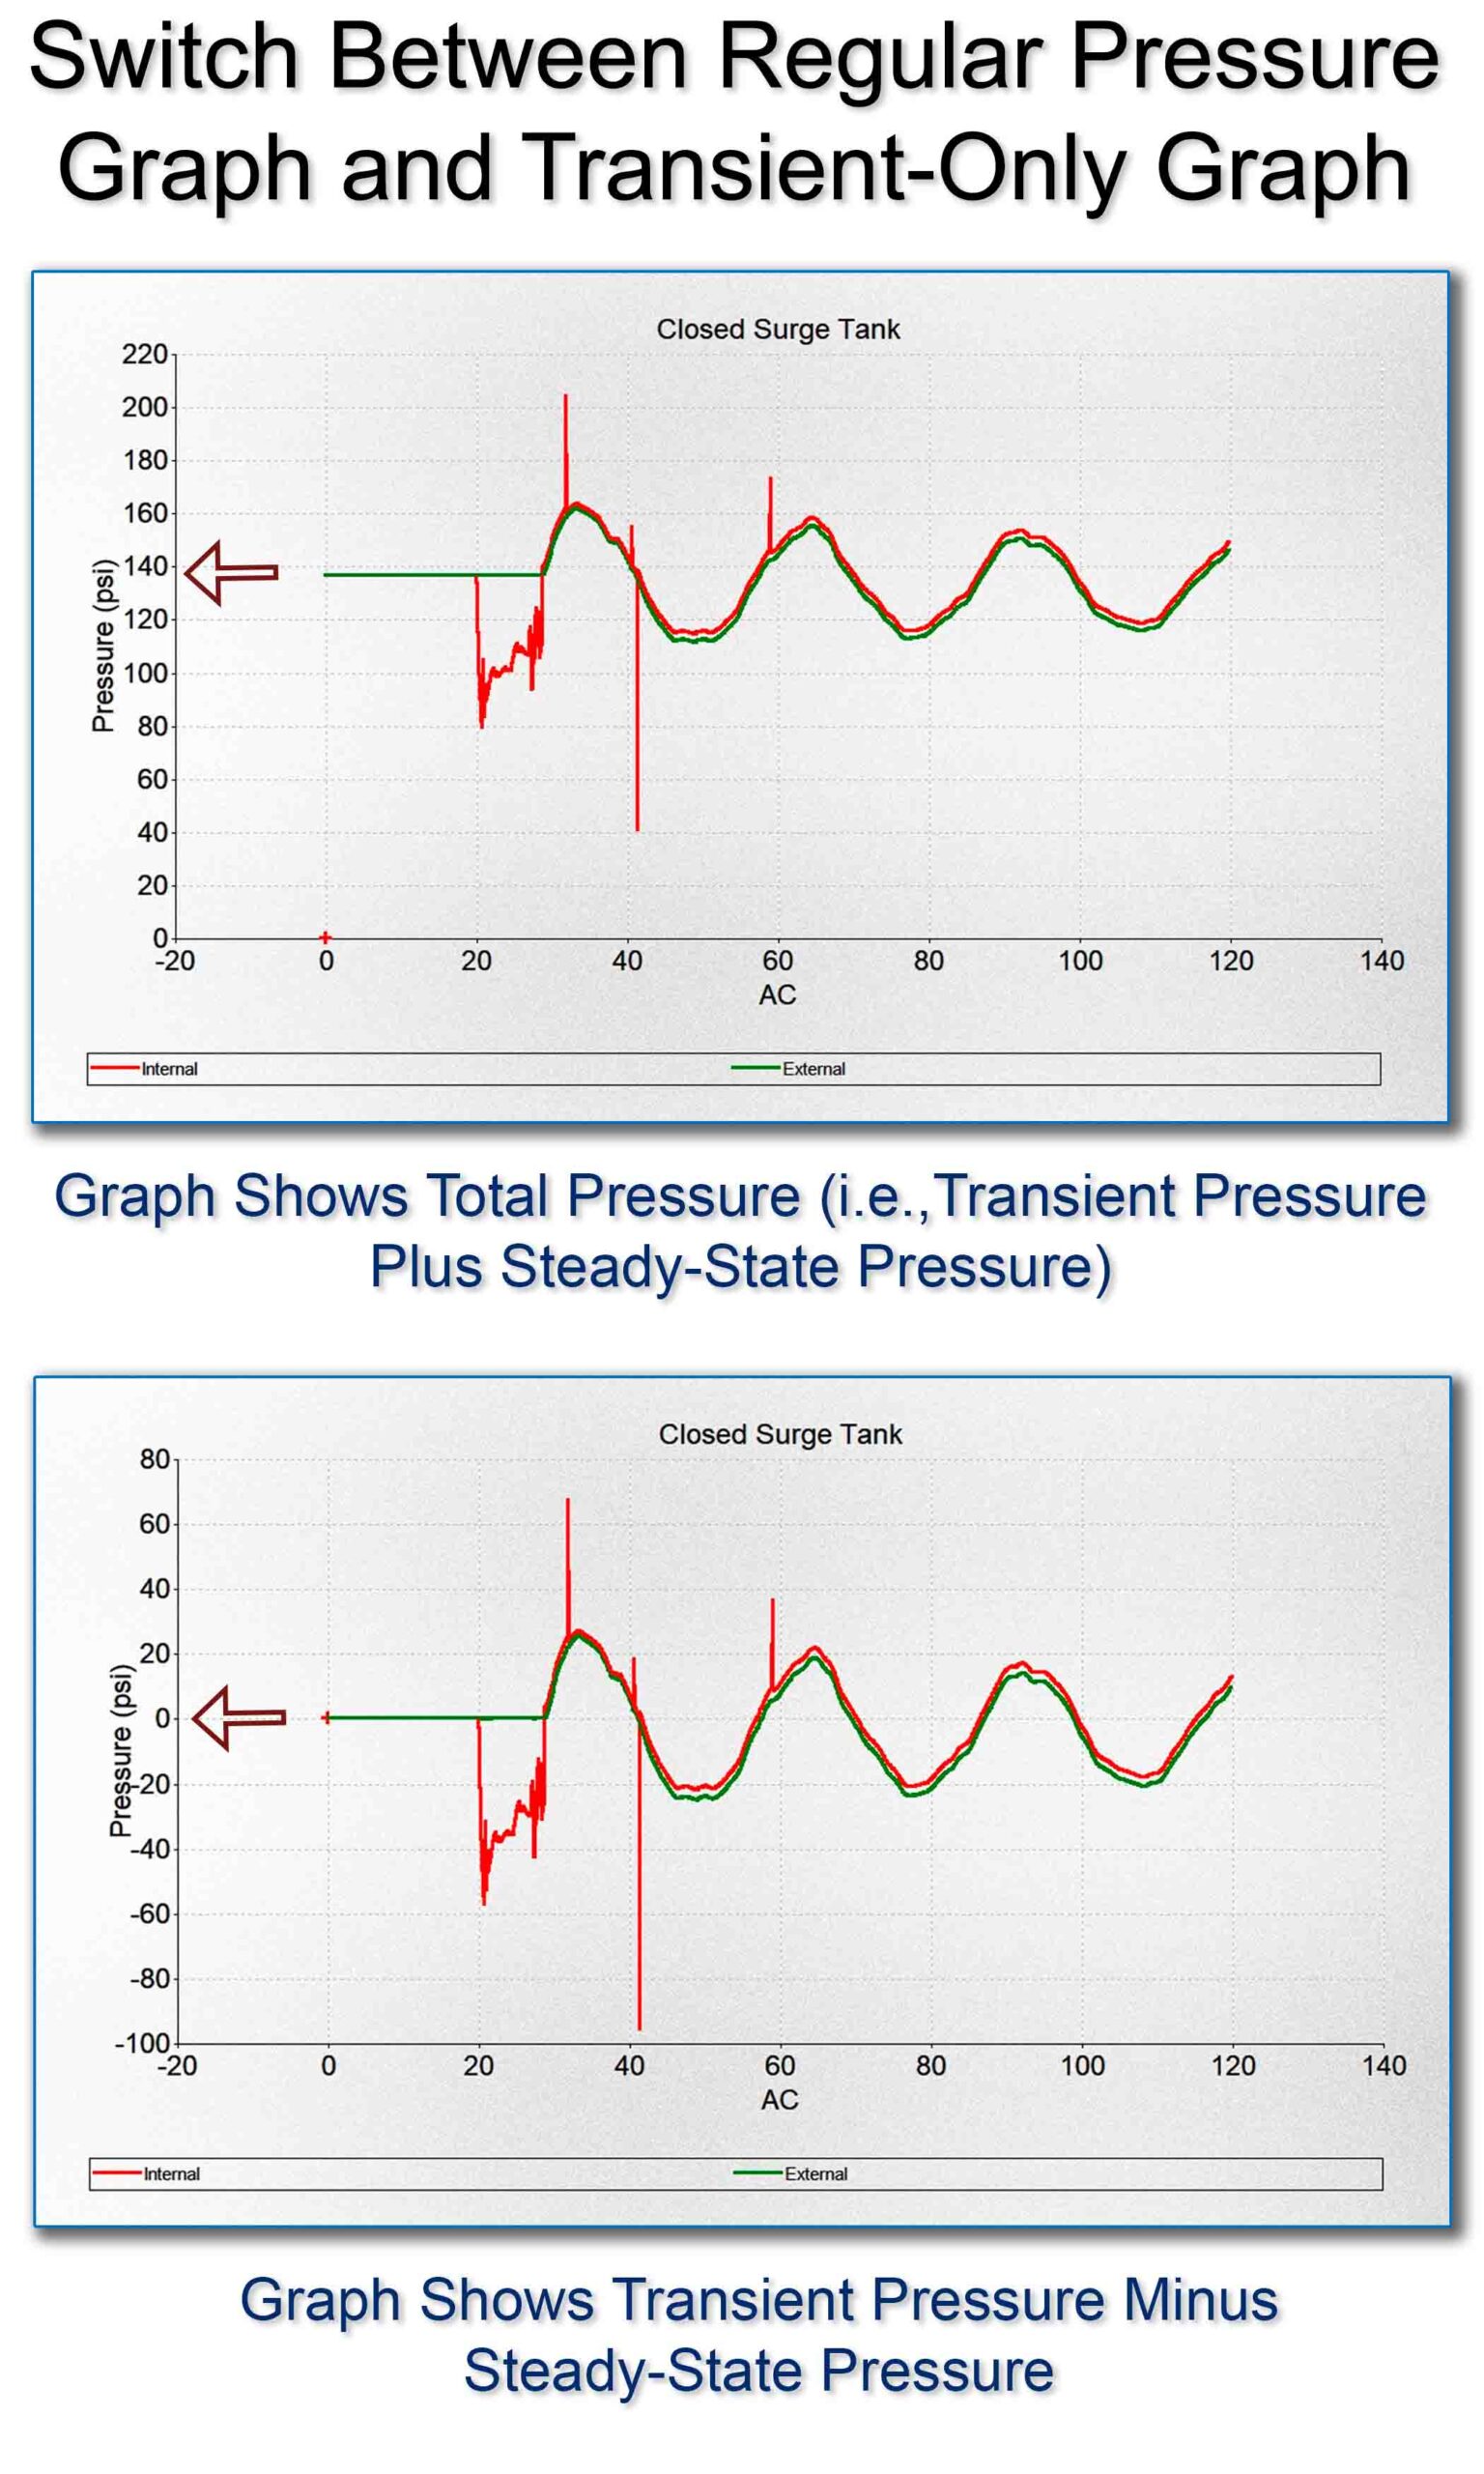
Transient Pressure Graph and Table. Formerly, Surge results were shown within graphs and tables as regular pressure results (i.e., the gauge pressure within the system). New for Pipe2024, This feature allows the user to plot/view only the transient-related pressures within graphs and tables – the steady-state pressures are mathematically removed from the curves/results so that graphs and tables only display the effects due to the transient-producing event(s). Thus, the pressure value on the graph starts at 0 psi instead of the steady-state gauge pressure within the system.
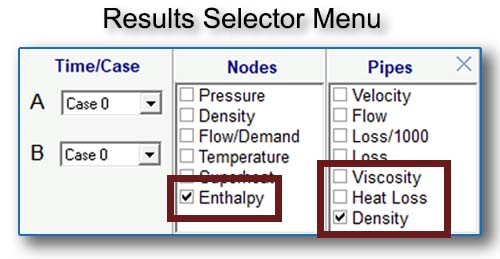
Superheated Steam/Temperature Sensitive Analysis now adds additional pipe and node results to labels in the Map Area, as well as to Tables, Graphs, etc.
Prior to 2024, the following output parameters were available:
Pipes:
- Pipe Flow Rate.
- Head Loss.
- Heat Loss.
- Velocity.
- Average Viscosity.
- Average Density.
Nodes:
- Loads in lbm/hr (or kg/hr).
- Loads in MBTU/hr.
- Enthalpy.
- Pressure, in absolute units as well as gauge units.
- Density.
- Temperature.
- Saturated Temperature.
- Superheat (if applicable).
New in 2024, pipe results now include Pipe Viscosity, Pipe Heat Loss, and Pipe Density. Also, node results now include Node Enthalpy.
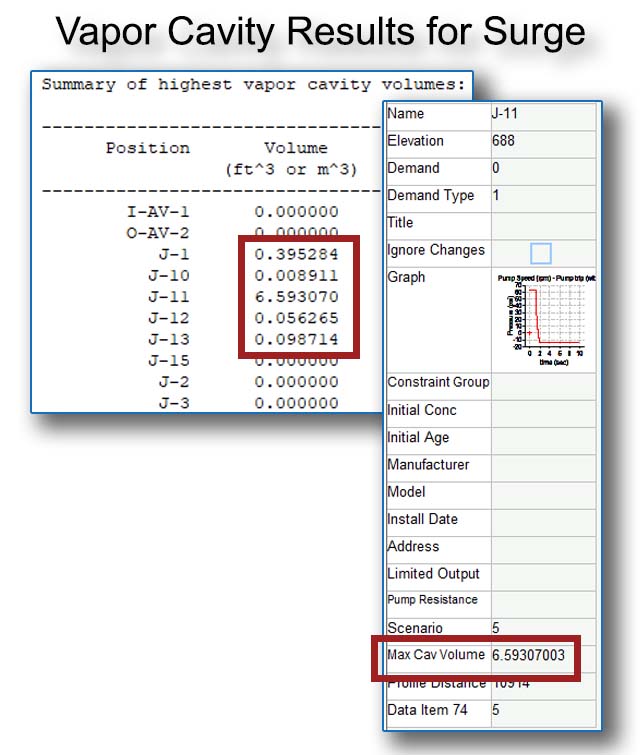
Maximum Cavitation Volume Now Available. Previously, Surge computed the cavitation volume at each node, but these data were not readily available to the user. New for Surge in 2024, the software now reports the Maximum Cavitation Volume for the entire analytical run. These data are available both as a Report (encompassing the maximum cavitation volume at all nodes throughout the simulation) as well as an individual result that can be seen within the Node Info Window (which reports the mazimum cavitation volume for the entire the simulation at that node only).
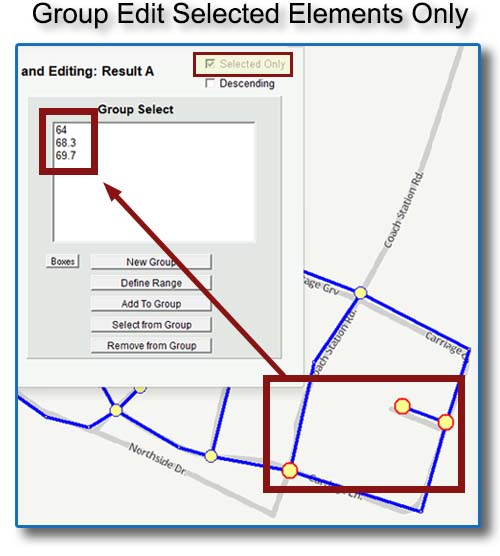
Group Edit Only Selected Elements. When group editing nodes or pipes, users can now choose the “Selected Only” option and the list of values in the Group Select box will only show values from the selected group. This is useful, for example, if the user wants to know the highest pressure among only the nodes in a specific group.
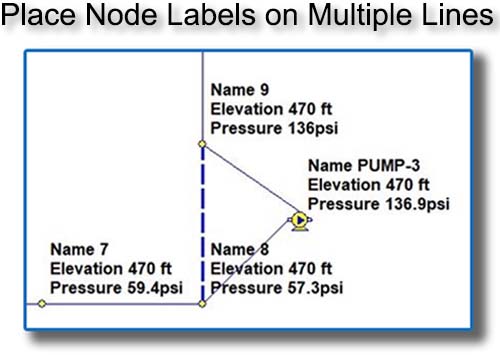
Multi-Line Node Labels. Previously, node labels were presented sequentially, that is to say, all on the same line, with a limited amount of overflow allowed. Now in 2024, node labels can be presented all on different lines for ease of readability.
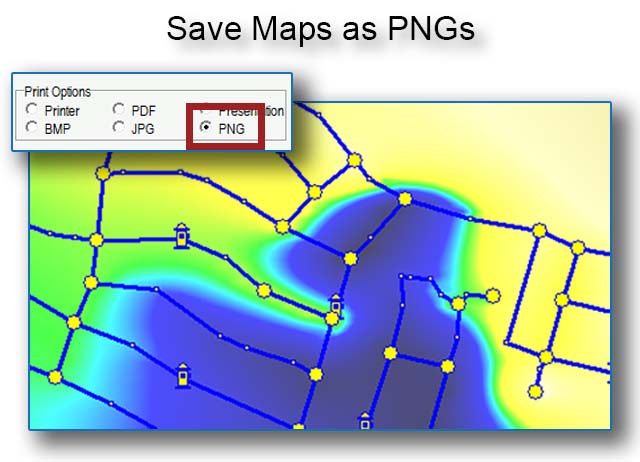
Print to .PNG Format. KYPipe can print maps to a hard-copy printer, or print electronically. While several electronic print formats were available before, new for Pipe2024, we have added the ability to print to .PNG format.
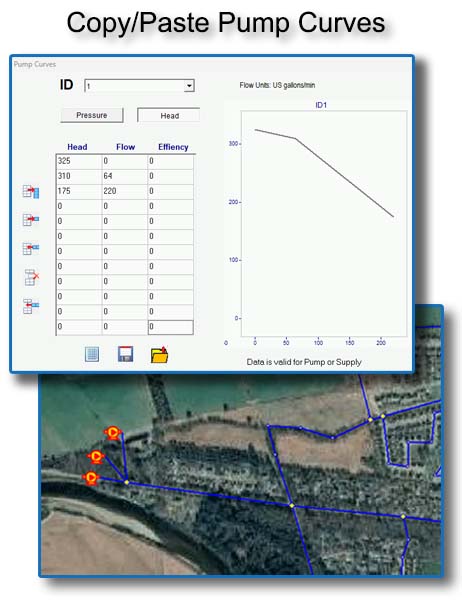
Copy and Paste Pump IDs. Before, users could copy and paste any node type along with its relevant physical settings (elevation, X,Y location, valve setting, pump speed, etc.) to a new location within the model, or to a separate model entirely. However, external data such as the head-flow data that comprises the pump ID for a given pump could not be copied with it, since the pump ID may not be unique to that pump. This feature allows users copy-and-paste the pump ID along with the other relevant node info for the pump.
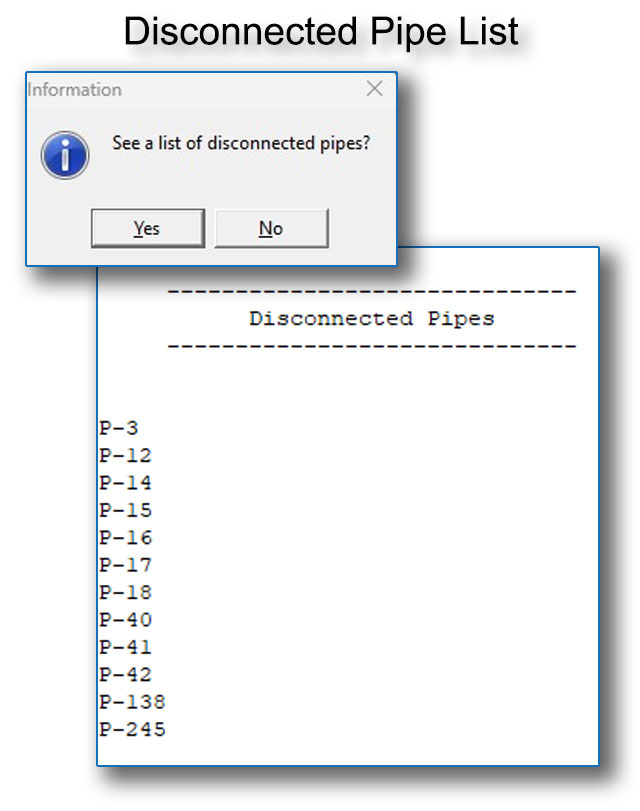
Generate a List of Disconnected Pipes. The Connectivity Check feature tests whether all the pipes in the system are connected to a user-selected pipe. New for 2024, if disconnected pipes are detected, the user will be given the option to display a list of the disconnected pipes in a separate report.
This is particularly useful in checking newly-imported modeling data from another source (e.g., Excel, ArcGIS, EPANET, AutoCAD). This is also especially helpful for tracking down hard-to-find or very small disconnected pipes.
Click here for a comprehensive feature list: All features.


