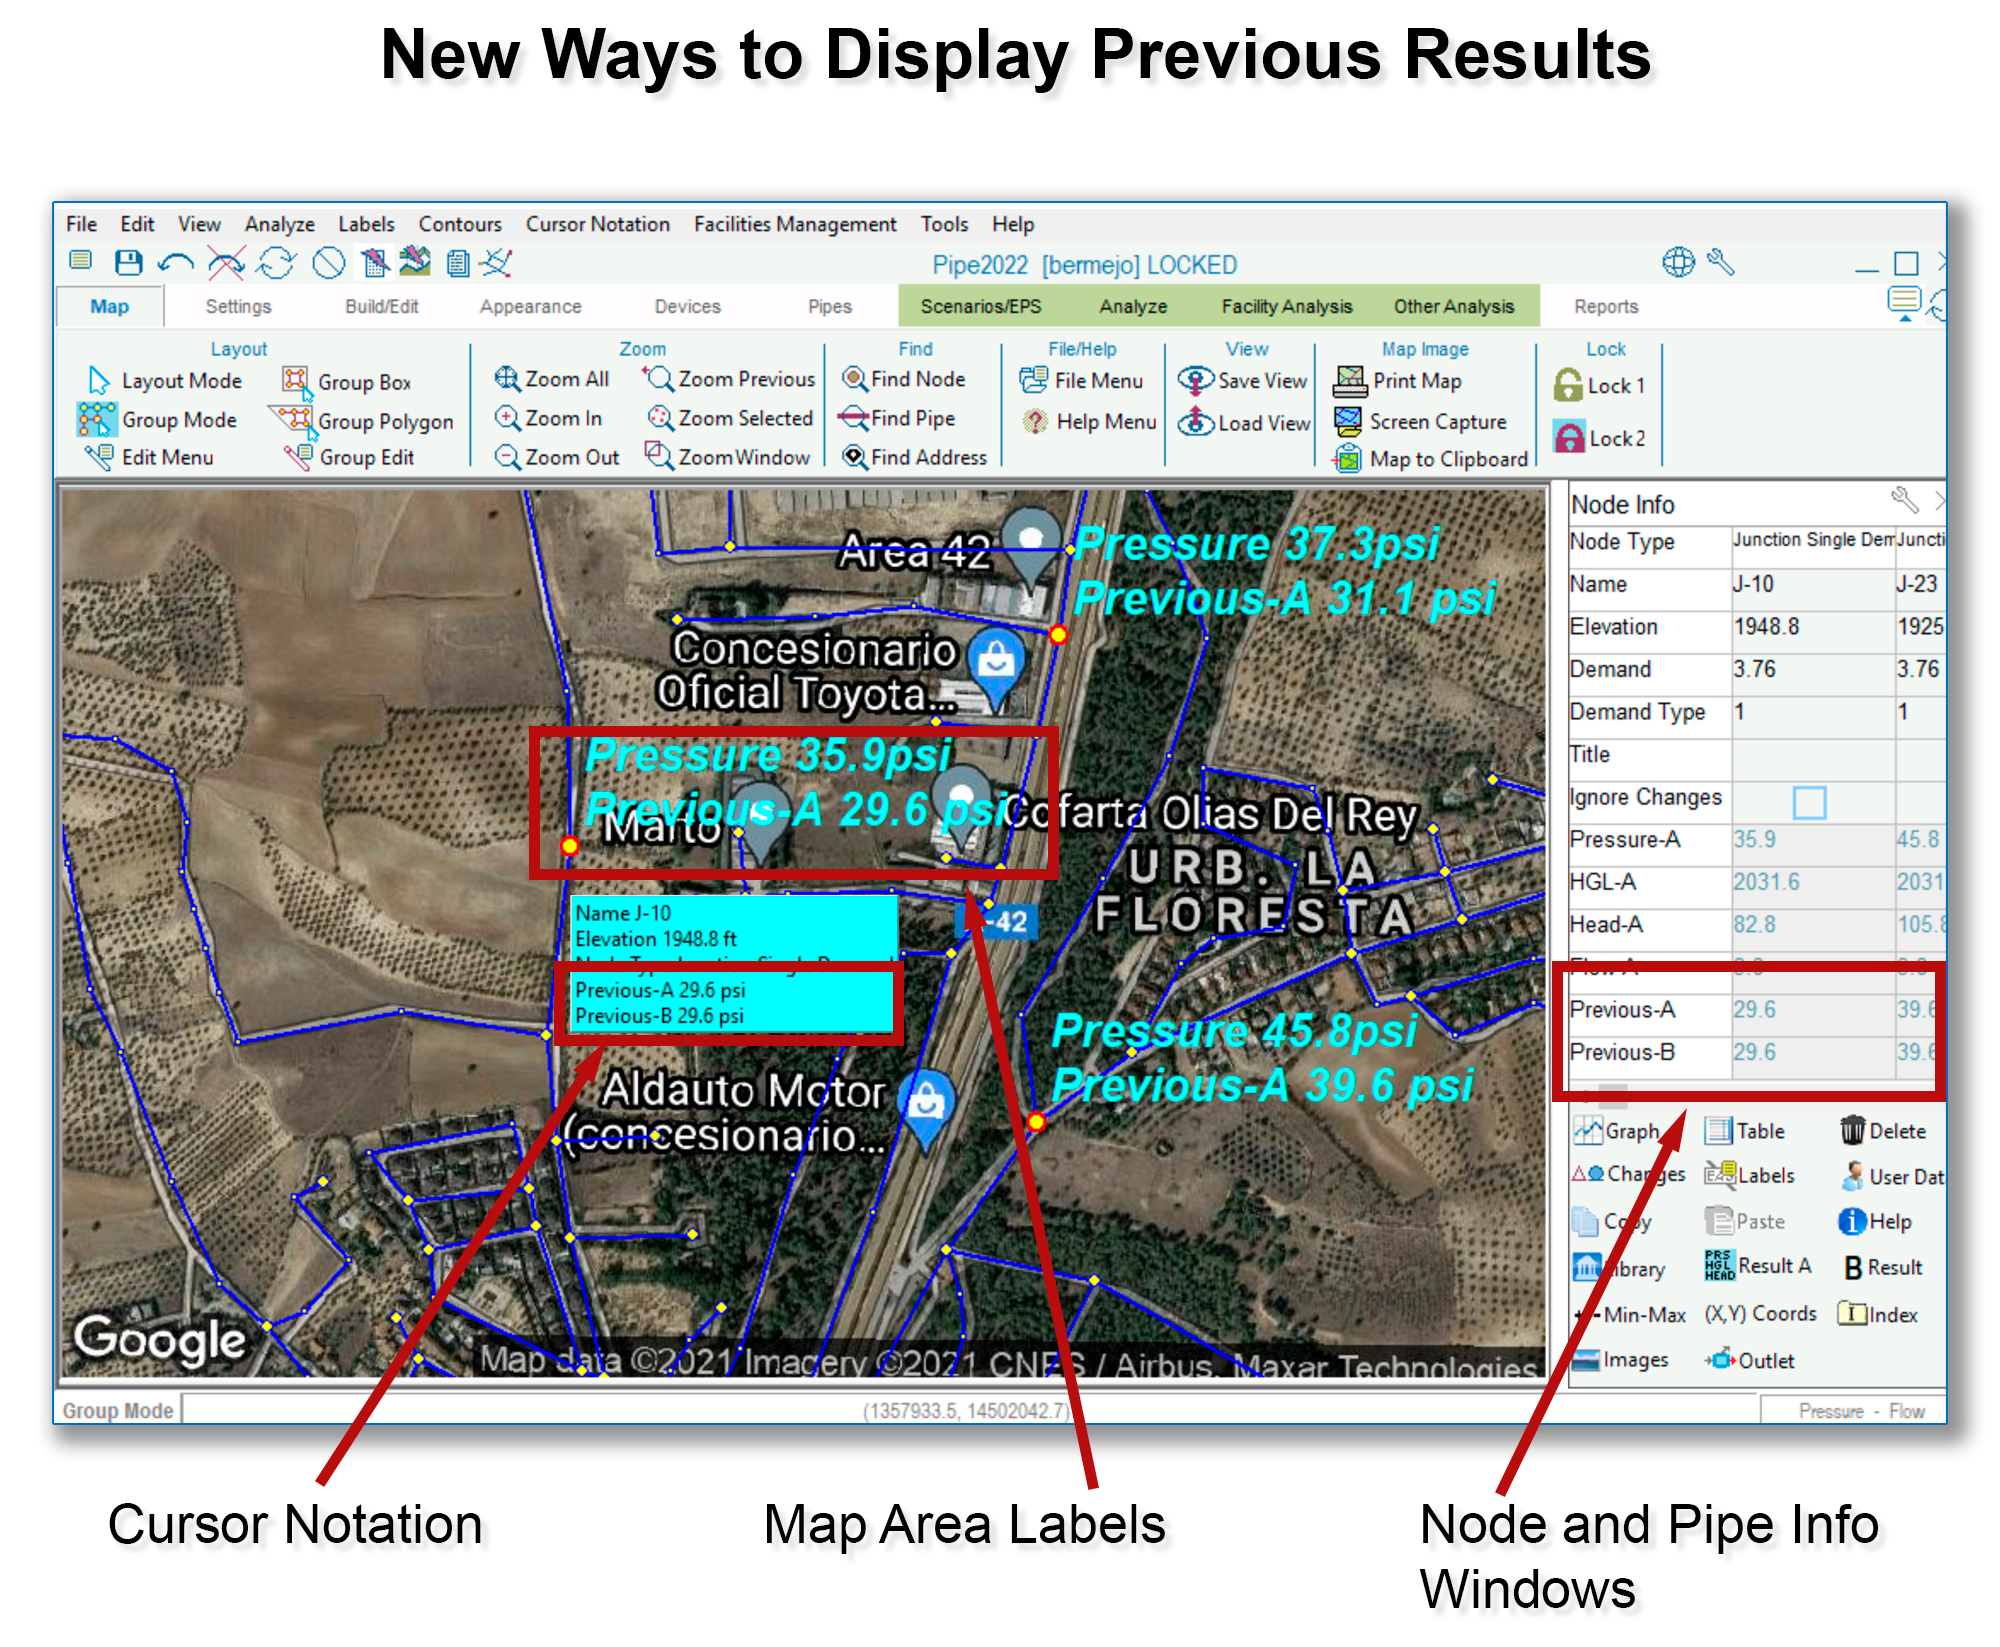
Previous Results (i.e., results from the analysis run immediately prior to the current one) have been available in tables and graphs. Now, these results can also be seen as labels within the Map Area, in Cursor Notations (which is the blue info box that appears when you hover over a node or a pipe), and in the Pipe and Node Info Windows, where this feature can be toggled on and off by clicking the “Result A” button at the bottom of the Info Window.
In the image above, “Previous-A” is set to display pressure, so the results shown are both pressure results, before and after adding capacity to the system (e.g., 35.9 psi vs 29.6 psi at node J-10).