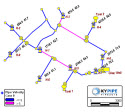
Originally developed by Civil Engineering professors from the University of Kentucky, KYPipe has been continually updated and maintained for over 40 years and is the most widely used and trusted hydraulic analysis engine in the world. KYPipe models water, petroleum, refined products, chemicals, refrigerants, low pressure sewer systems and more. It can be used for selecting and sizing pipes, pumps, valves, tanks and other devices. Calibration tools and pump operation optimization features help ensure sound modeling. Click here for our model comparisons and limitations page.
-
-
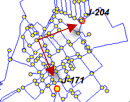
Import and export piping data (lines and polylines) from AutoCAD to create a pipe system. Import and export system data to and from GIS shape files and Google Earth. More…
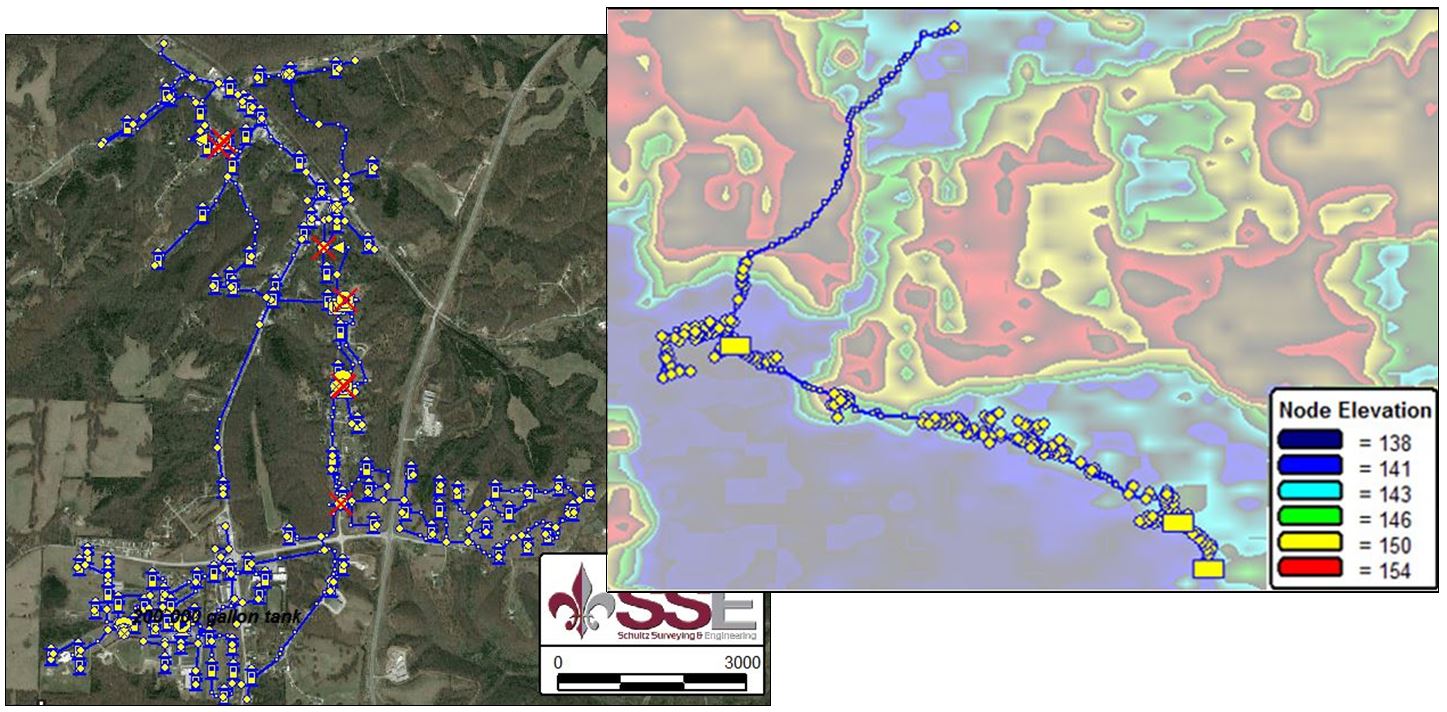
Internet Maps – Import maps and retrieve system elevations from the internet for model backgrounds and a complete contour reference. More…
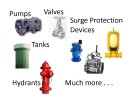
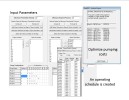
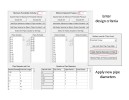
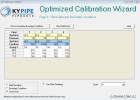
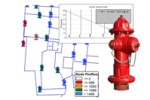
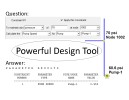
Backgrounds – Display image files in the background including DWG, DXF, PDF, BMP, TIF, JPG, and Internet Maps. More…Node elements & devices include junctions, tanks, reservoirs, pumps, sprinklers, regulating valves, control valves, etc. In addition, we model a number of unique devices such as hydrotanks, vacuum breakers, variable pressure supplies, combined holding tank-pump elements, loss elements, etc. More… Select the Pipe Type from one of many Pipe Schedules and the pipe data fields are automatically populated. This is a great time-saving feature. Users can create their own Pipe Schedules or select from hundreds available. More… Device Libraries – Users can create customized libraries which contain data for devices such as pumps, valves, air vacuum valves, surge tanks, back flow preventers, and pipe libraries. A library can be created for almost any device. A large number of pipe libraries are distributed with the software. More…The Optimal Pump Scheduling tool computes the most economical and efficient way of operating complex water distribution systems with multiple pump stations. More… The Optimal Design Module calculates the optimal diameters for a specified section of a system to minimize the total pipe cost. More… Optimized Calibration minimizes the difference between observed field data and model predictions considering all test data simultaneously to provide the best calibration possible. More…Hydrant Flow Calculation provides the calculated fire flow for each hydrant which maintains a specified minimum pressure anywhere in the distribution system as well as the required pressure at a pumper. More… Flushing Planner Analysis identifies pipes that attain a specified minimum velocity based on flushing scenarios. Results are displayed using pipe color codes, a special set of map labels, and a Flushing Report. More…
-
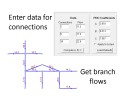
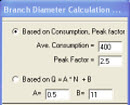
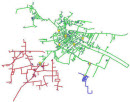
Instantaneous Peak Demand Rural Analysis calculates model demands using Peak Demand Diversity curves recommended for rural and sparsely populated water systems. Conventional designs often lead to undersized piping and low pressures. More… Meters provide a powerful alternative to allocated junction demands. Place one or more metered connections at any location in any pipeline and associate these meters with the user and demand type. Demands are automatically assigned to junctions. More… Pressure Sensitive Demands for KYPipe Allows demands to vary as pressures vary in the system over time. Demand Types & Patterns factors (multipliers) entered into the program table will vary multiple types of demand over time. More… Automatic Demand Distribution – Specify the total demand and the number of residential connections and the demand will automatically be distributed throughout the system. This is a tremendous time-saver. More…Direct Parameter Calculations allow you to calculate the operating or design parameters that exactly satisfy stated pressure requirements at designated locations in the piping system for a range of operating conditions. More… The Branch Diameter Calculation feature is another unique time-saving feature that gives the user the ability to assign the diameters of branch lines based on the design flow. More… The Operational Control Settings screen is a unique and very useful tool for presentations and operational and design studies. There is no better tool for presenting the impact of changes in the operation of a distribution system. More…Extended Period Simulation simulates extended periods (e.g., 24–144 hours) with pump and tank controls, demand curves, and specified changes at designated times. More… Sprinkler Systems and hydrant system layouts can be built with automatic pipe layout grids which is a huge time-saving feature when building models with many duplicate grid sections. More… Temperature-Dependent Analysis allows for modeling liquids with significant changes in density and viscosity at different parts of the distribution system. More…The Presentation Generator creates detailed PowerPoint, Microsoft Word and HTML reports within the KYnetic interface. Add maps, images, videos, tables and graphs for dynamic presentations. More… Locate Pressure Zones – Find and emphasize pressure zones in a system. More… Printing, Images, and PDFs – Export maps, graphs, tables and reports directly to a PDF, JPG or BMP file without loss of quality. More…
-

-

-
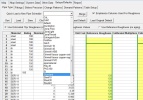
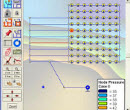
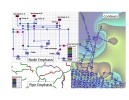
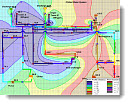
Contours and Emphasis – Generate, display and print contour maps for a variety of node data and results (e.g., elevation, pressure). More… Pipe Profiles – Animated pipe profiles provide a spectacular presentation tool. Specify the first and last nodes and the rest is done automatically. More… Animated Maps – Apply timed color emphasis to pressure contours and demand nodes to create stunning animated presentations. More…Complete Water Quality Analysis capabilities using EPA guidelines as required by some regulatory agencies. The EPANET Water Quality program is used for these calculations. More… The Optimal Water Quality Sensor Placement Tool is a simplified guidance tool for optimal placement of sensors in small and medium water distribution networks. More… With Water Quality Calibration, Bulk Reaction and Wall Reaction Rates for pipes are optimized based on field data. These rates are required data in the calculation of chemical concentrations in water over time. More…Skeletonization – Eliminate pipes based on their characteristics while maintaining all system demands, pumps and supply nodes. More…Fittings/Loss Coefficients – Enter the number of each type of fitting from the extensive drop-down list and the loss coefficient Ks are automatically summed for any pipe section.
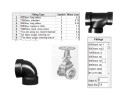
Minor Losses for Pipe Fittings
Displays the travel distance from a selected node to all other nodes in the system (KYnetic only). More…The Pipe2016 program was validated by comparing the results from several different models generated by the already-validated Pipe2010 program, which is a predecessor of Pipe2016. More…


