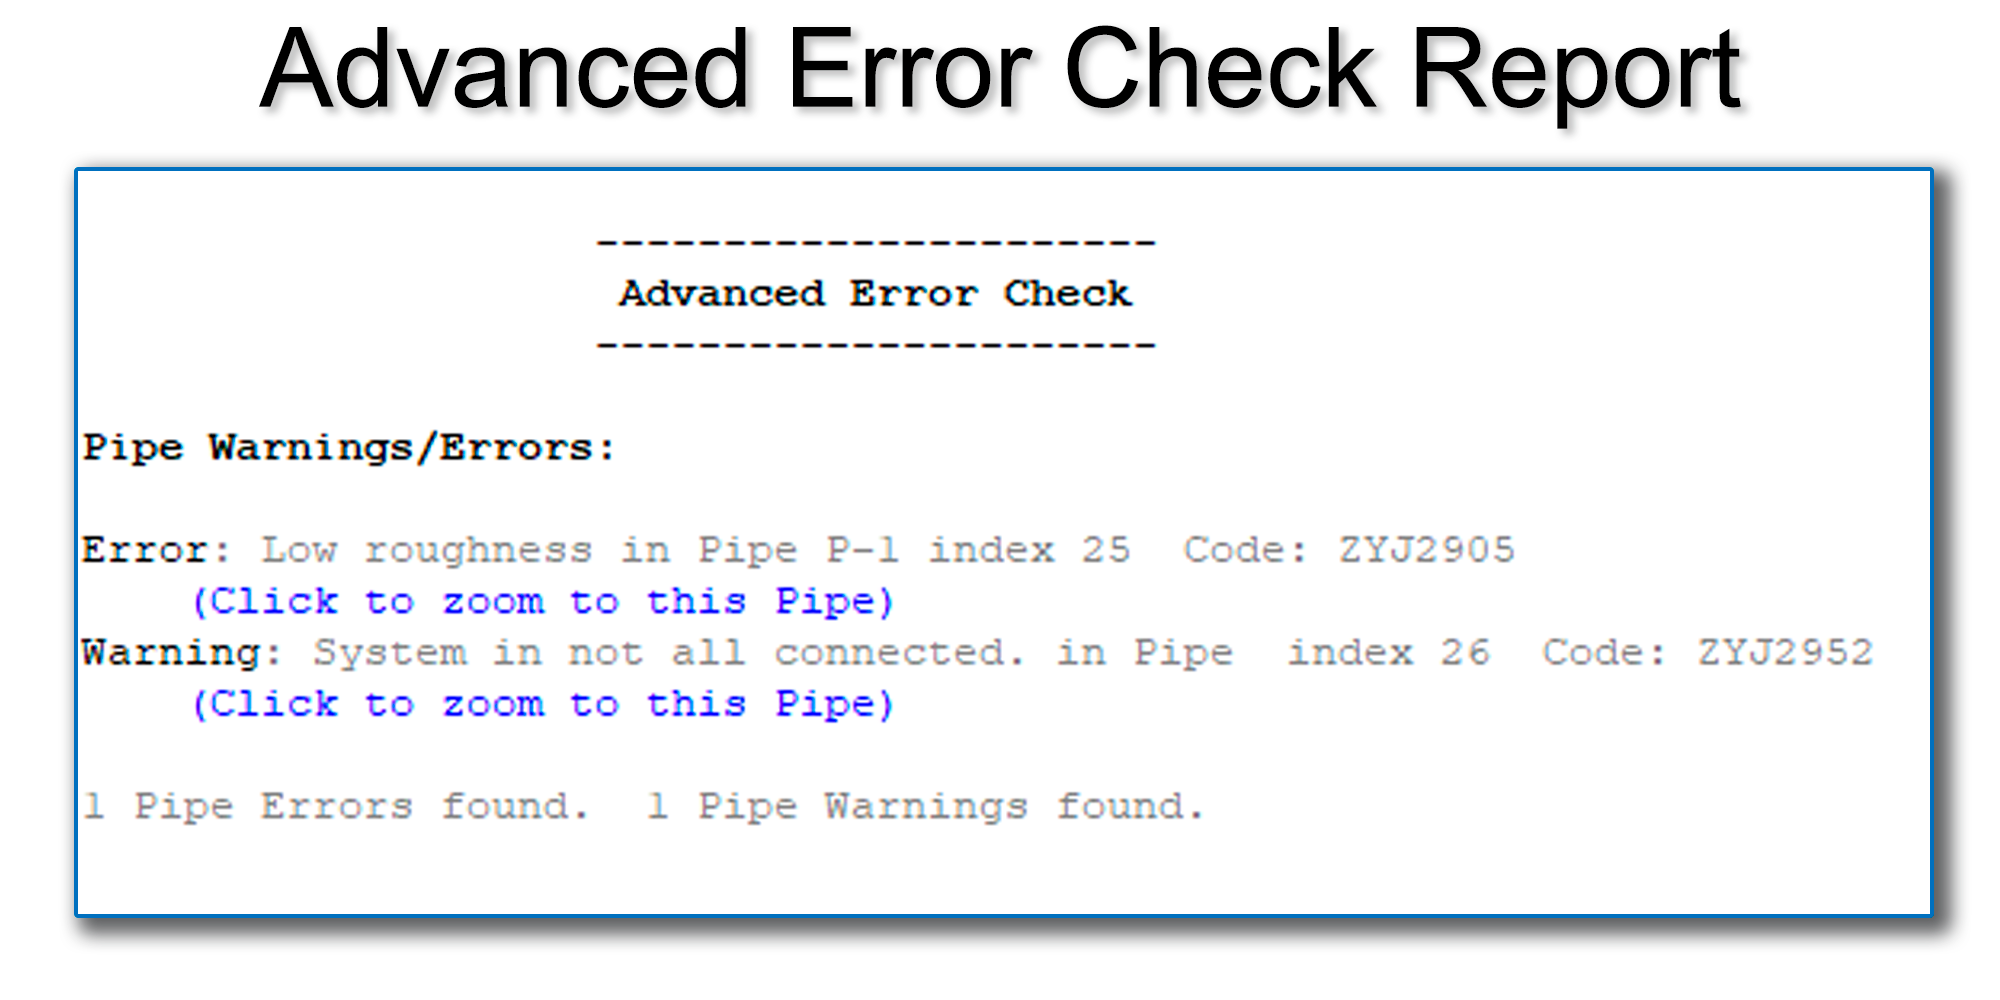
Advanced Error Check Feature. This feature creates a centralized list of Error Messages and Warning Messages compiled from decades of technical support and model troubleshooting experience, reporting both critical errors and settings changes (warnings) that may not be immediately apparent when the model is analyzed.
This list can be generated before an Analysis has been run, placing the user just one click away from the List of Errors/Warnings before conductiong the analysis. See more here (Advanced Error Check).
Create animated or simple pipe profiles for pipelines or a path through a looped system. Specify the first and last nodes and the rest are done automatically. The HGL envelope and results may be displayed. More
AutoSave is automatically enabled when creating new files, but may be turned off by the user. The time interval for autosaving may be set by the user, but defaults to 10 minutes. Autosaved copies are not automatically implemented; load any autosaved copy from the Autosave Menu, then save it manually, and it will become the working copy. The user is prompted before autosaving, and an option exists to accept or skip the autosave.
Connects disconnected pipes. If pipes cross but are not connected, this feature will add a junction node at the connection point (KYnetic only). Improved for 2026, now end nodes that are disconnected from pipes can be automatically snapped to the nearest pipe. Formerly, only hydrants, meters and on/off valves could be snapped to the nearest pipe. More
Import demands to junction nodes or as residential meters on pipes using an Excel spreadsheet to match junctions/pipes within the model to addresses or latitude/longitude values in the spreadsheet. More
This feature allows users to input an allowable node pressure range (e.g., 30 psi to 100 psi for a municipal system), and the software determines the difference between the pressure at any given node and the upper and lower ends of the range. Specifically, the Design Point is defined as the percent difference between the user-defined upper/lower pressure limit for each node (which are set using either the Global Values or Local Values) and the pressure value calculated for that node by the model during analysis. So, for example, if the Design Point = 75.5%, then the calculated pressure is 75.5% of the way to the Design Point. The formula for calculating the design point is 100% * (Value – Min Value)/(Max Value – Min Value). More
Varies a parameter value within a specified range to see the effect on the system. The parameter is associated with a double-sided node such as a pump or valve. The user selects a parameter within the node input data, then defines an allowable range. The program will run multiple analyses simultaneously to output the variation in the remainder of system based on iterative values within the allowable range. For instance, vary the flow coefficient of a valve to see the effect on the system pressures and flows. This is a KYPipe-only feature, available within the KYnetic Interface and the KYnetic Ribbon Interface. More
Node elements & devices include junctions, tanks, reservoirs, pumps, regulating valves, loss elements, and loss elements defined by manufacturer data from a library. More
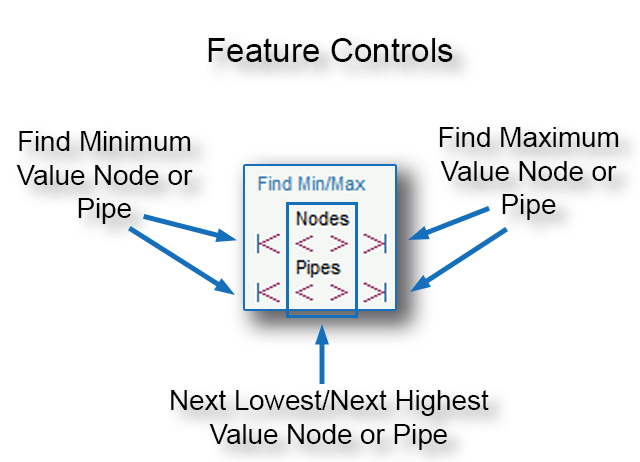
This feature toggles sequentially between nodes with higher or lower values of Result-A, including buttons to immediately display the node or pipe with the highest or lowest value of Result-A. Result-A is a placeholder that can be set to display the following system variables:
Nodes
Enter the number of each type of fitting from the extensive drop-down list and the loss coefficient Ks will be automatically summed for any pipe section.
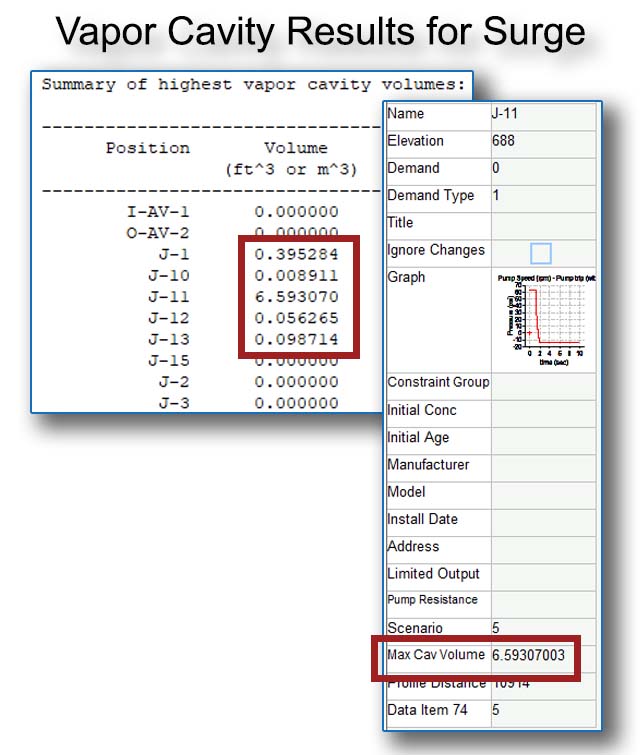
Maximum Cavitation Volume Now Available. Previously, Surge computed the cavitation volume at each node, but these data were not readily available to the user. New for Surge in 2024, the software now reports the Maximum Cavitation Volume for the entire analytical run. These data are available both as a Report (encompassing the maximum cavitation volume at all nodes throughout the simulation) as well as an individual result that can be seen within the Node Info Window (which reports the mazimum cavitation volume for the entire the simulation at that node only).
The Operational Control Screen is a unique and very useful tool for presentations and operational and design studies. There is no better tool for presenting the impact of changes on the operation of a distribution system. More
Select the Pipe Type from one of many Pipe Schedules and the pipe data fields are automatically filled or create a customized schedule which may be reused in multiple models.
Create detailed PowerPoint, Word & HTML reports within the KYnetic interface. Add maps, images, videos, tables and graphs for dynamic presentations. More
The Profile View allows the system to be seen in a side view for any defined profile. System data and results are still accessible but editing is not allowed. Fast switching between the plan and profile view.
Pumps in combination with Hydropneumatic Tanks (hydrotanks) are often used in piping systems with no storage capacity. The Pump Cycles tool helps to size and validate hydrotank/pump combinations based on different demand levels with a goal of idealizing the number of pump cycles required. This is a Premium Surge feature. More
QuickView limits map features, making loading and editing large modeling files faster. When a large model file is detected during loading, the interface automatically prompts the user with an option to enable this feature. It is automatically turned off when making presentations, or when the Map Refresh button is clicked. QuickView can easily be turned on and off while editing a file.
The Snap Hydrants, Valves, and Meters feature connects floating nodes to the nearest pipe. This is useful when adding hydrants, etc., from GIS data to an existing model. More
Users can perform a steady-state analysis before beginning a transient analysis, verifying model validity. A steady-state analysis can also be used to generate a system curve.
When utilizing this feature, the user clicks on a pipe, and the software simulates a break, performing a transient analysis at that location. The area of the pipe break can be determined by the user (from 0.0 to 1.0 times the cross-sectional area of the pipe). There is no need to set up and simulate the pipe break via the Node Changes Table.
Siphon breakers, dynamic air valves, pressure relief valves, surge anticipation valves, surge bladder tanks & electronically-actuated surge anticipation valves are just a few of the unique devices available. More
The System Curve feature from KYPipe is now available in Surge. Users can plot the system curve against the pump curve of any pumps in the model, or in a pump library. Further, this feature can add curves based on multiple pumps in series or parallel. Users can also plot the System Curve against the current pumps in the model or library, designating Speed Ratios above or below 1.0
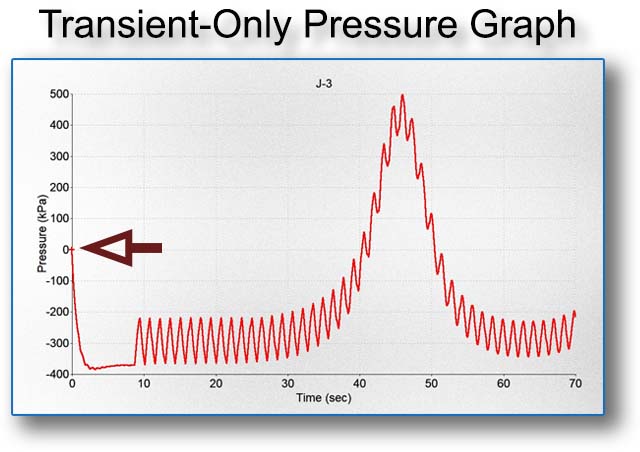
Transient Pressure Graph and Table. Formerly, Surge results were shown within graphs and tables as regular pressure results (i.e., the gauge pressure within the system). New for Pipe2024, this feature allows the user to plot/view only the transient-related pressures within graphs and tables – the steady-state pressures are mathematically removed from the curves/results so that graphs and tables only display the effects due to the transient-producing event(s). Thus, the pressure value on the graph starts at 0 psi instead of the steady-state gauge pressure within the system.
Sometimes issues occur when users run modeling files that are stored on external locations, including cloud locations, and shared or network drives. This feature is designed to allow users to seamlessly maintain project folders in these external locations. Upon opening a modeling file, this feature copies the file from the shared drive/remote folder to the local folder, and the user works from there until the file is closed. At this point, the modeling file is written to the shared drive. This is useful for users who are required to maintain a central store of files.
Surge Protection Device Limit Increased – (Surge only) the allowable number of SDOs, or surge protection devices of all kinds, has been increased from 600 to 1000.
We Are Available
Technical support for our software is free. Software developers and engineers are the experts who make up the KYPipe Technical Support team. Unlike many of our competitors, technical support for our users is provided at no additional cost. You may contact any one of a number of software developers and engineers with your questions about using the KYPipe suite of models.
HOURS – various team members cover these hours
Monday - Friday | 7 AM - 7 PM
Saturday | Closed
Sunday | Closed
Email and contact form 24/7 at - kypipe.com