-
Learn More. (KYPipe and Surge, KYnetic only) This tool shows the check valve position at all simulation times. it displays an animation of a check valve associated with a pump, showing positive pressure, sub-zero pressure and cavitation pressures in both the inlet and outlet side of the pump. Useful for diagnosing check valve slam and check valve chatter. Play the full simulation time from the beginning, or use a slider to freeze or go back for a portion of the simulation.

Inlet and Outlet Pressure Gauge View Pump Inlet and Outlet Pressure Gauges and Flow Arrows. Pressure gauges are shown within the animation with default or user-defined pressure ranges; the gauge needle turns red during periods of cavitation. Flows in and out of the pump are represented by vector arrows which change direction and scale. The scale can be left at the default setting or changed by the user.

Cavitating Liquid Immediately See Positive, Negative and Cavitation Pressures. The animation displays three different images for the water within the pump inlet and outlet pipes, depending on whether the pressure in the pipes is positive, negative but not cavitating, or below negative atmospheric pressures, indicating cavitation.
KYnetic Ribbon (KYnetic only) enhances navigation using a combination of text and icons. Collapse the ribbon to use the original KYnetic Toolbar.
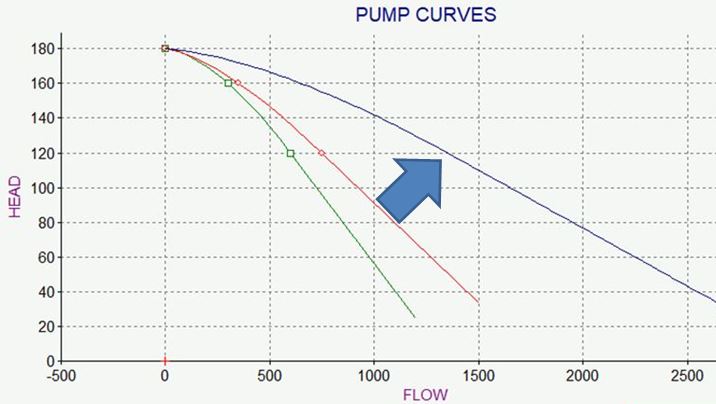
Combined Pump Curves Create a combined pump curve in either series or parallel for any two pump IDs in the model.

-
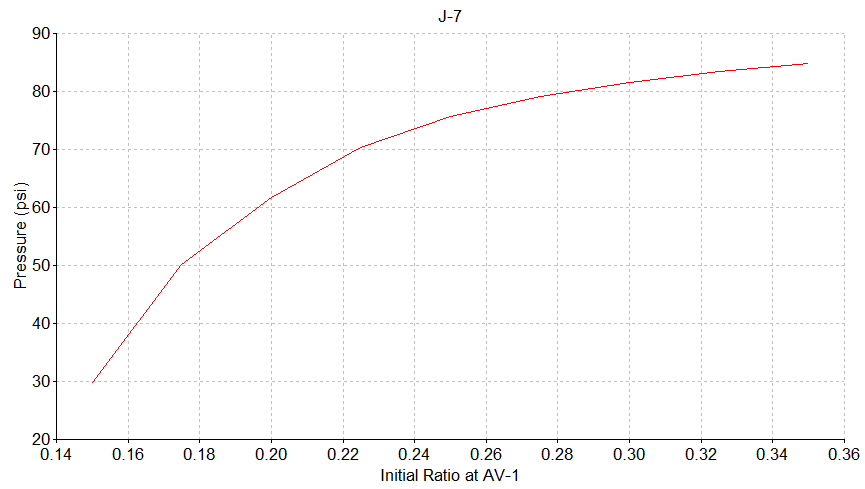
Device Parameter Range Analysis for an Active Valve: Output for a Nearby Node Device Parameter Range Analysis. (KYPipe, KYnetic only) Varies a parameter value within a specified range to see the effect on the system. The parameter is associated with a double-sided node such as a pump or valve. The user selects a parameter within the node input data, then defines an allowable range. The program will run multiple analyses simultaneously to output the variation in the remainder of system based on iterative values within the allowable range. For instance, vary the flow coefficient of a valve to see the effect on the system pressures and flows. This is a KYPipe-only feature, available within the KYnetic Interface and the KYnetic Ribbon Interface.
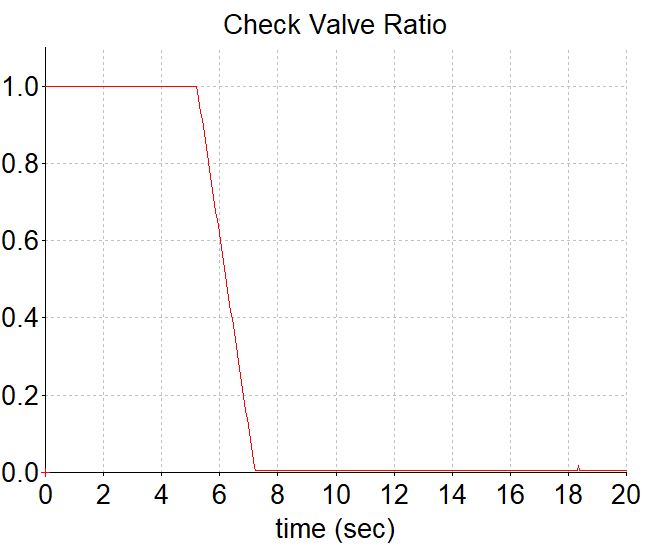
Learn More. (KYPipe, Surge, KYnetic only) This graph displays the position of the check valve throughout the simulation period, with a position of zero representing a fully-closed check valve, and a position of 1.0 representing fully-open check valve. This graph is available within the check valve animation feature and as part of the normal node output graph by clicking on any pump with a check valve. Thus check valve position can be plotted against other output parameters such as suction and discharge pressure as well as pump speed.
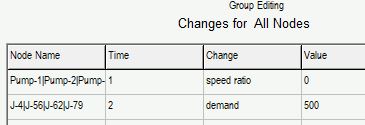
Group Edit Node Changes. (KYnetic only) Typically, node changes are input individually for each node. Creating the same change for different nodes involves retyping the change. This feature allows the same change (for instance, turning nodes on, or changing all junction demands) to be implemented for multiple nodes at the same time. Additionally, nodes can be added to the selected group, or removed from the group, without the need to edit the changes created.
-

-

-
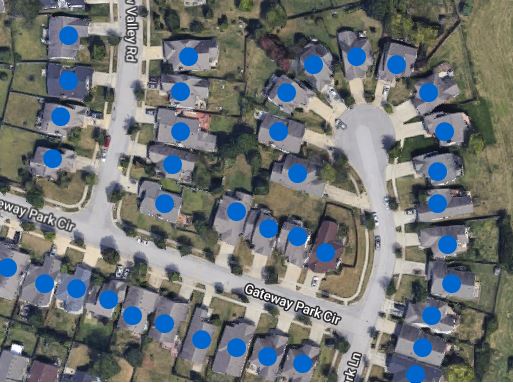
Import demands to junction nodes or as residential meters on pipes using an Excel spreadsheet to match junctions/pipes within the model to addresses or latitude/longitude values in the spreadsheet.
Light MapQuest Background Users can now load MapQuest Internet maps with alternate default background settings including off-white or almost black in order to better constrast with pipes and nodes. Regular map features such as roads, route numbers, water bodies, and place-name text labels are still displayed.

Many More Surge Protection Devices Allowed Surge Protection Device Limit Increased – (Surge only) the allowable number of SDOs, or surge protection devices of all kinds, has been increased from 600 to 1000.