-

-
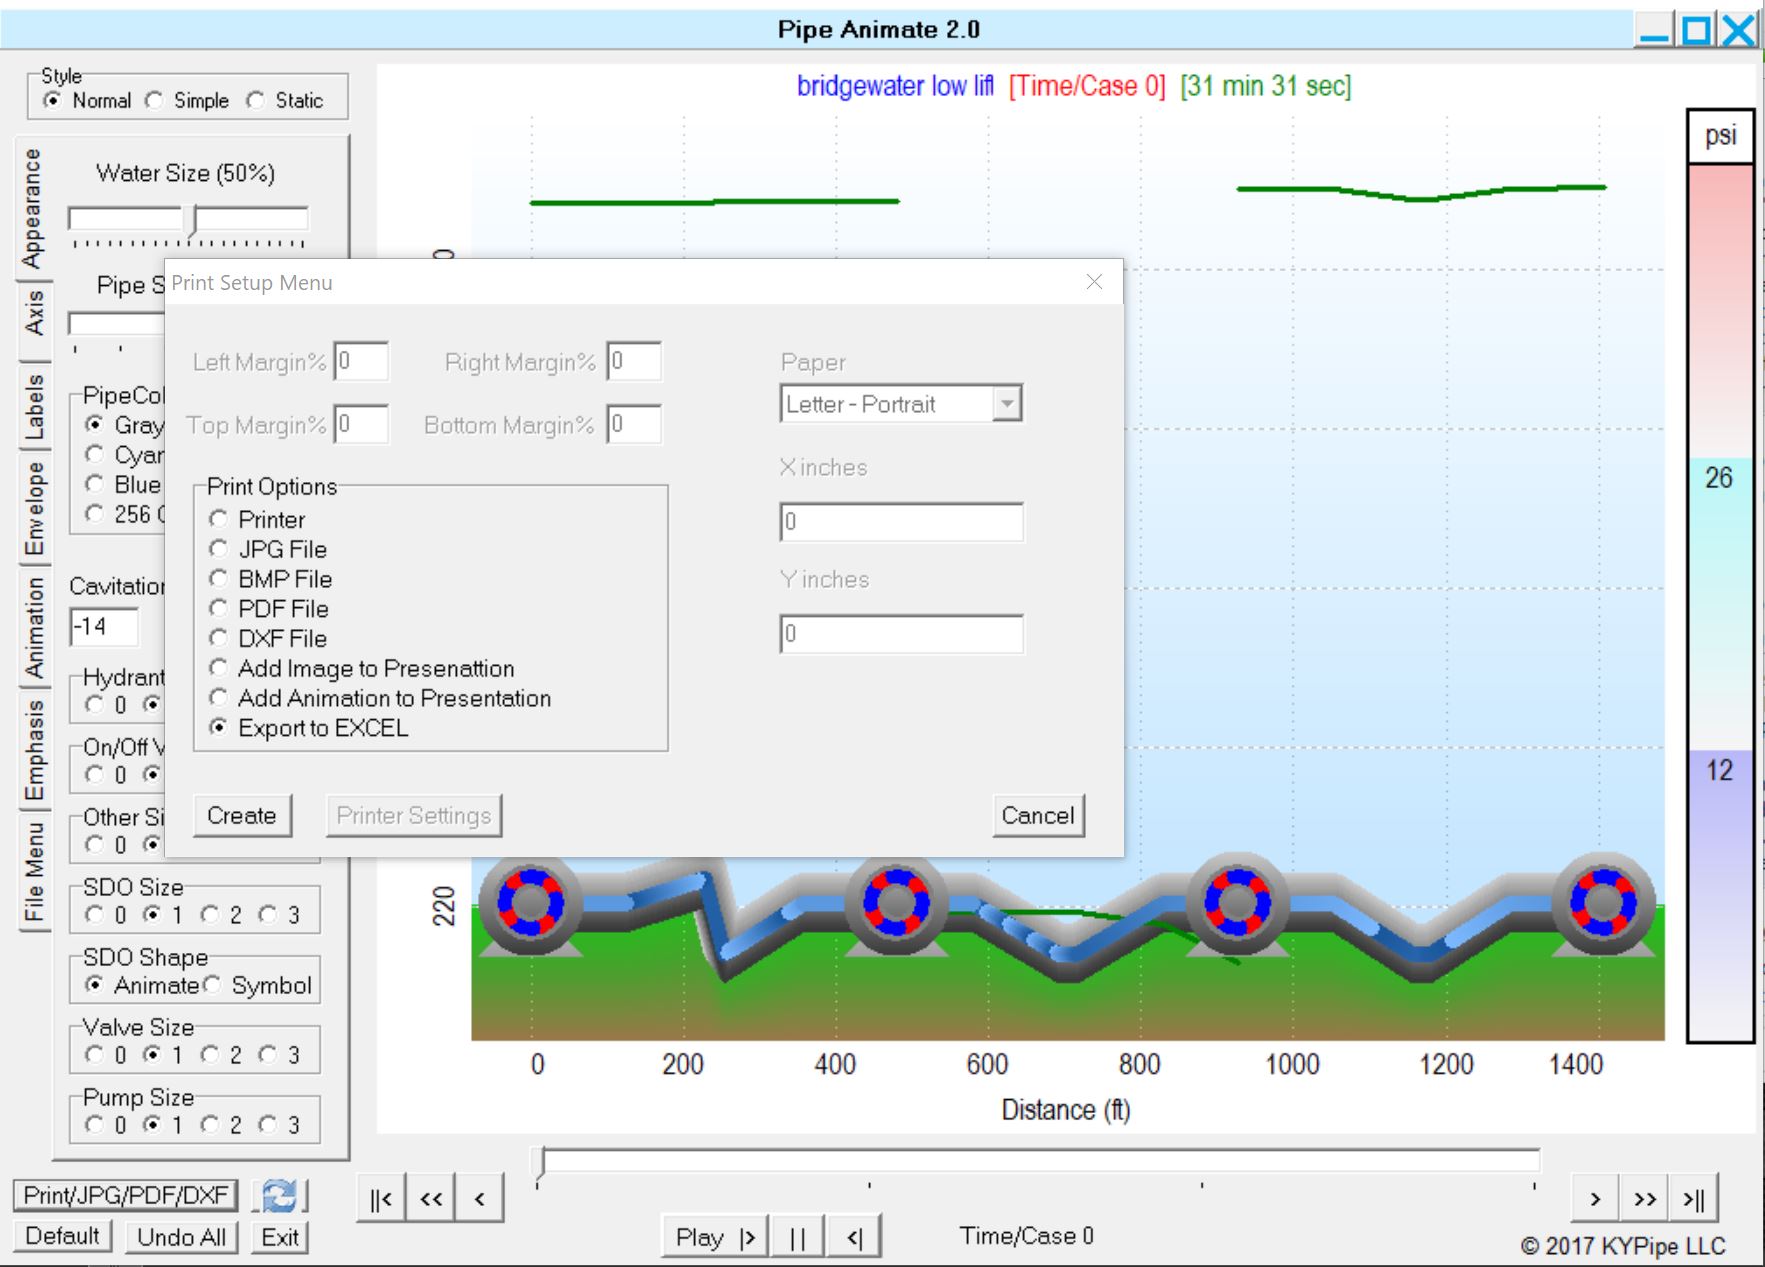
Export to Excel
Export Curve Data to Excel (CSV). Export head-flow data from pump curves to an Excel file.
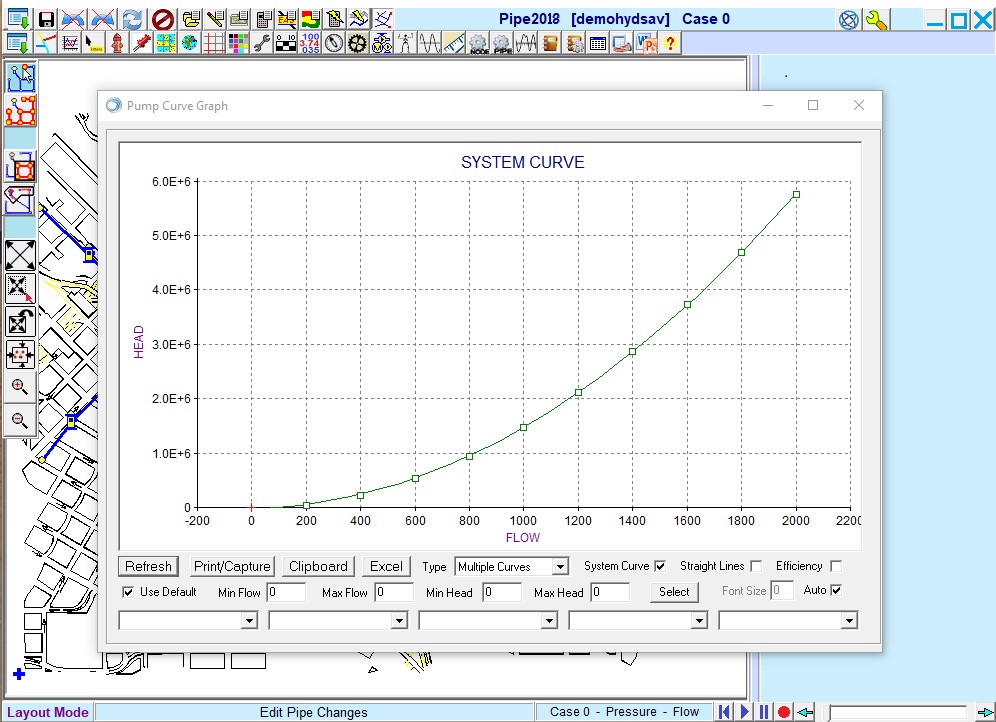
Surge System Curve
Surge System Head Curves. Create system head curves within Surge. Formerly a KYPipe-only feature.
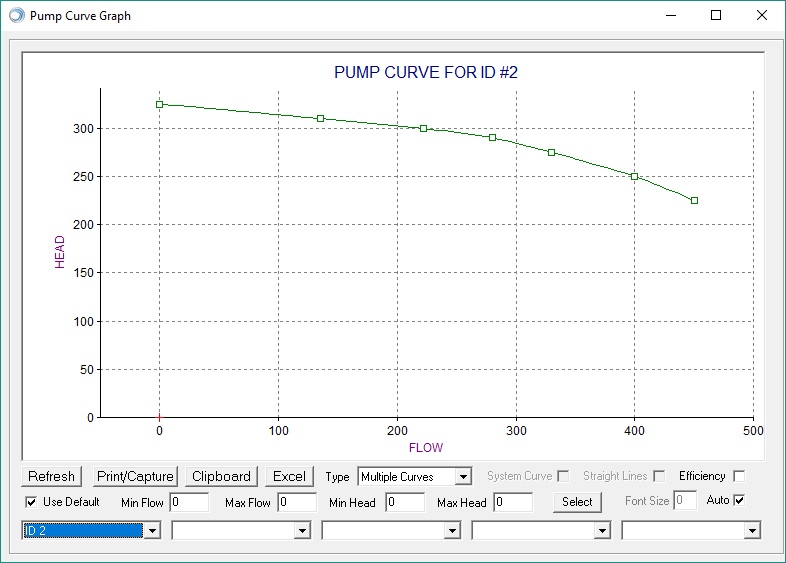
Curves for More Types of Pumps
Rated/Single-Point Curves. Create, view and export curves for rated pumps and single point pumps.
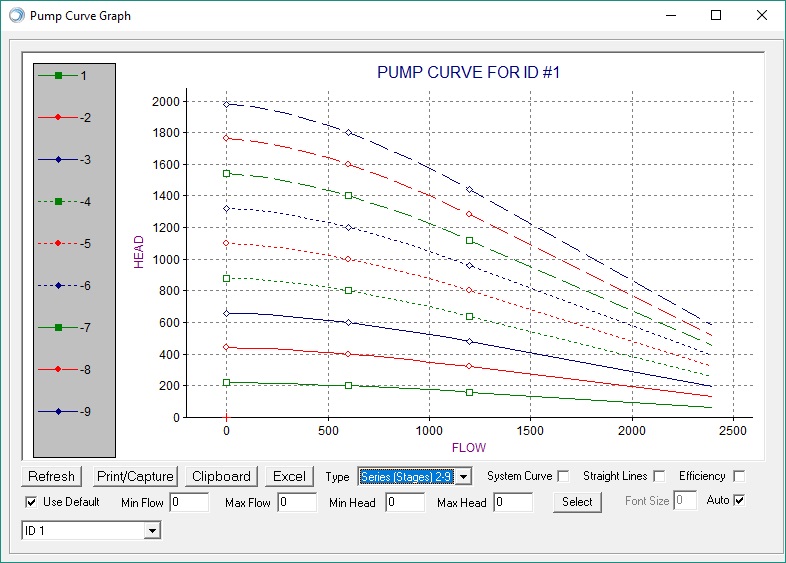
More Curves for Pump Stations
Series or Parallel Pump Curves Graph. Curves for 2-9 pumps in series or parallel are displayed instead of 6-9.
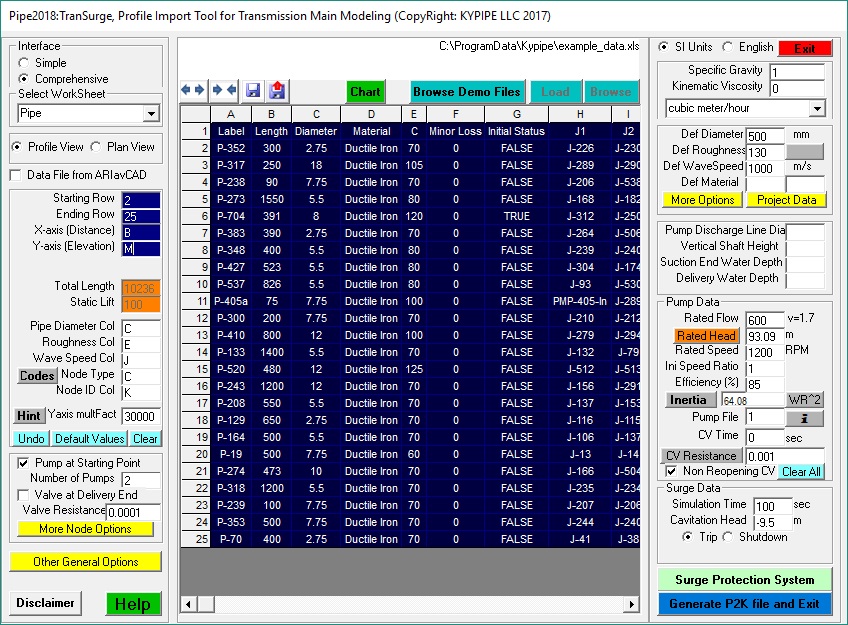
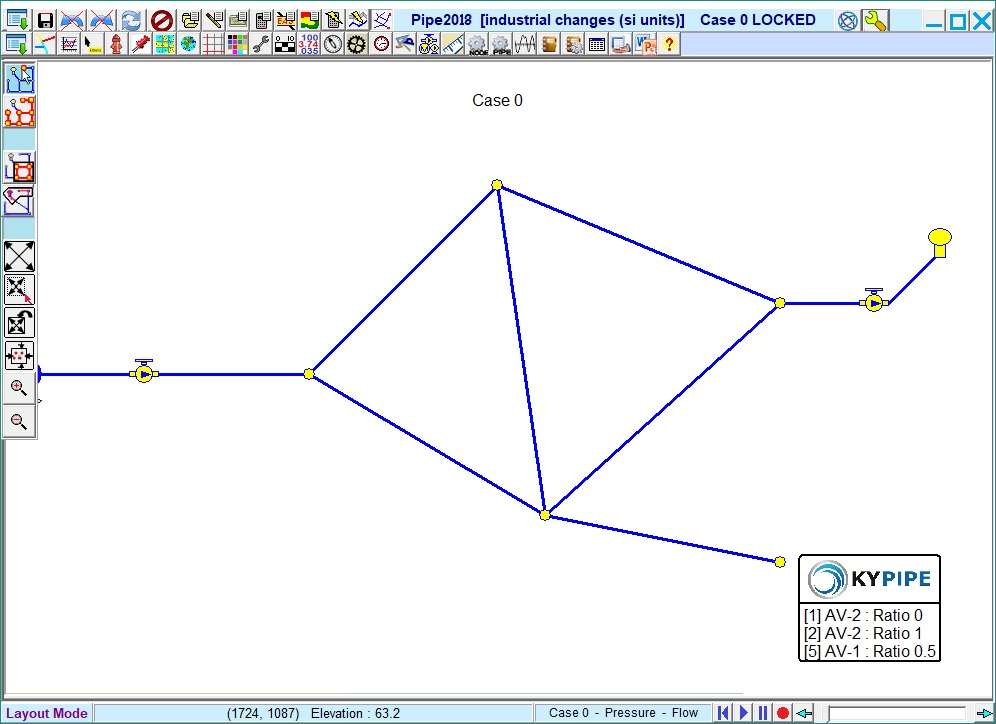
Updated Import Tool
This more comprehensive import tool makes it easier to create a TranSurge model from an Excel file. Improvements include changes to pump station import, more imported elements, and a quick chart that can be used for air valve placement. More…
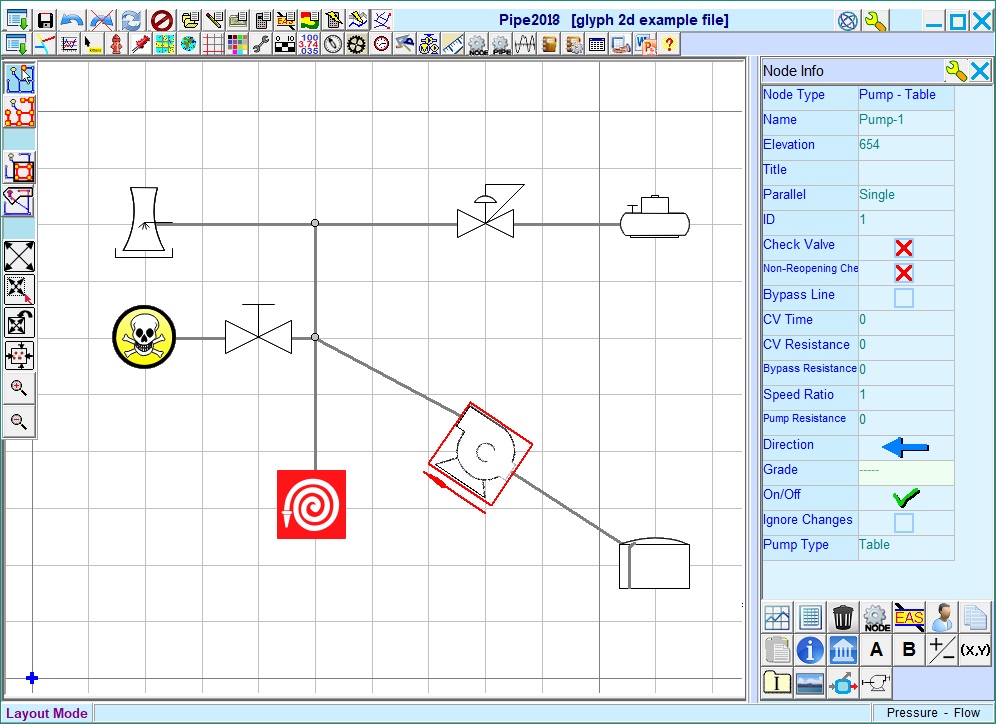
New Node Glyphs for PIDs
Node Glyphs (Limited Control in Classic). Allows the user to create Piping and Instrumentation Diagrams (PIDs) using a menu of customizable symbols, called glyphs to differentiate them from the normal model symbols. Glyphs can be rotated and their size can be changed. Includes both 2-D and 3-D glyphs. More…
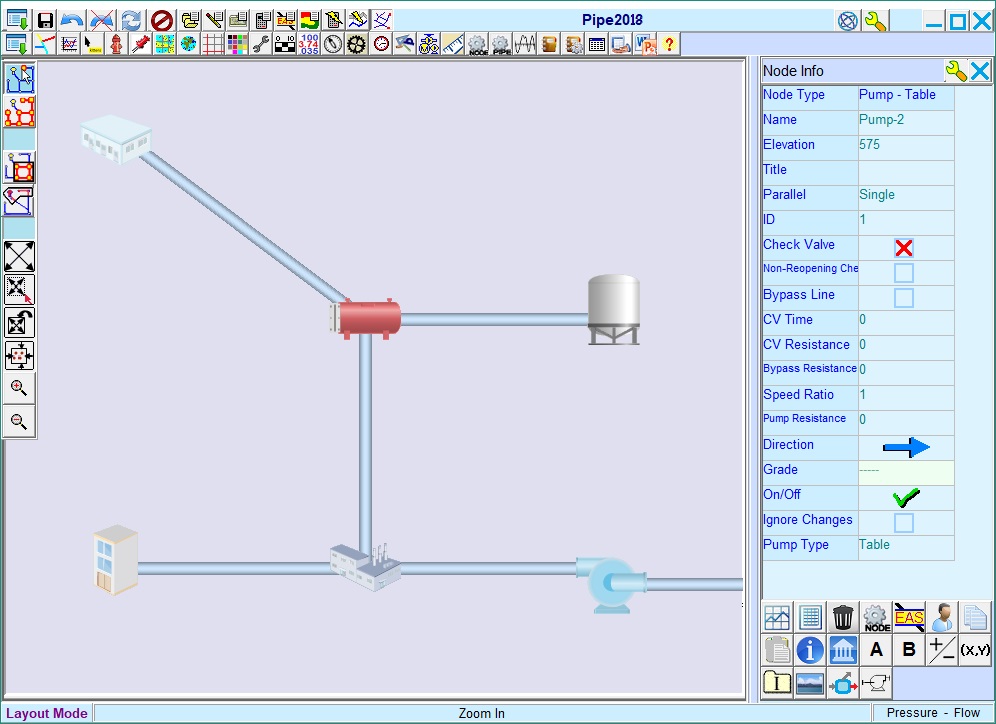
3-D Pipes for PIDs
3D Pipes. Create 3-D pipes of different widths and styles to match optional 3-D glyphs when building a Piping and Instrumentation Diagram.
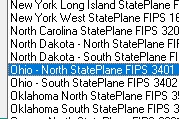
Select New Coordinate System from an Extensive List
Converts pipes to a different coordinate system while keeping the current latitude and longitude so the pipes will appear at the same geographical location.
-
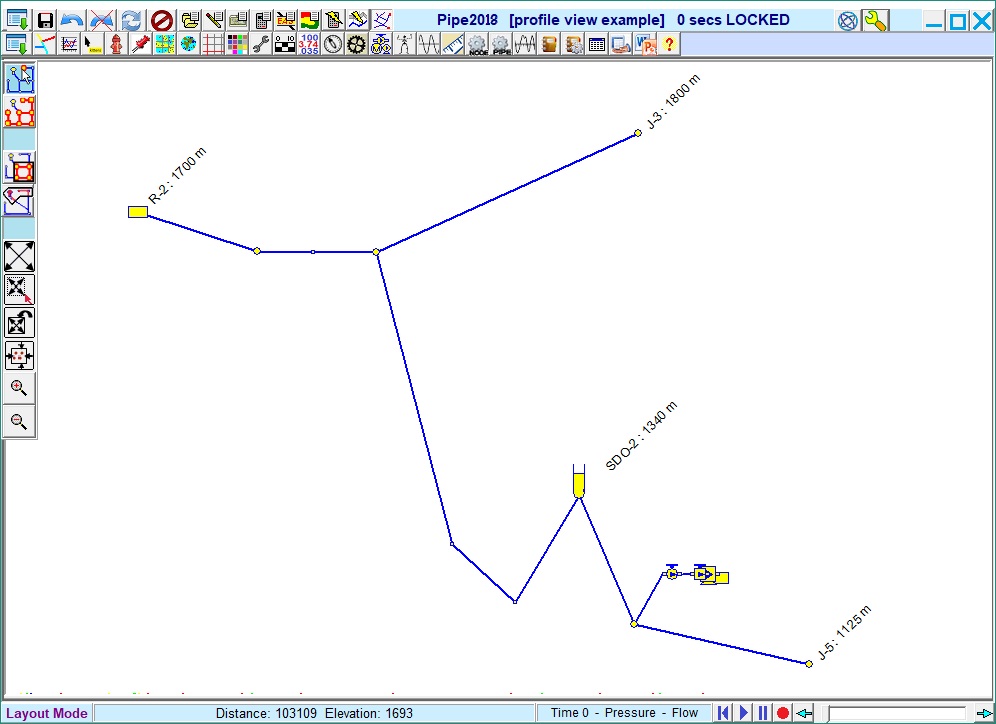
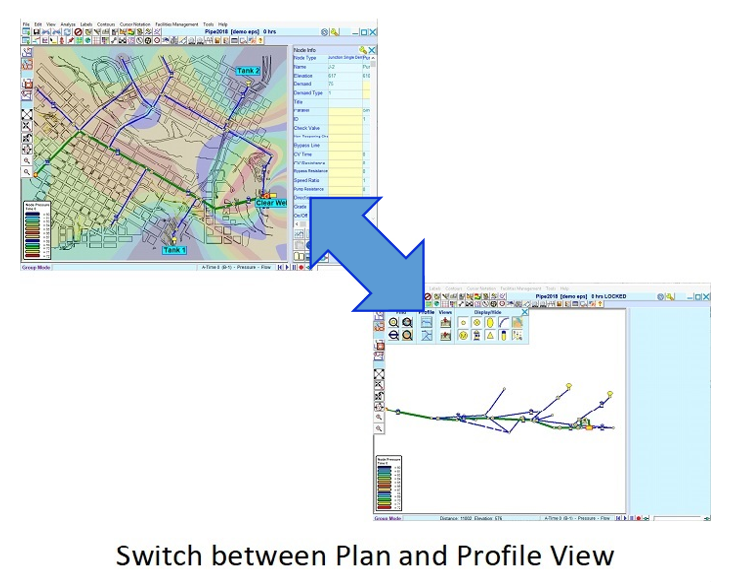
New View of Piping Systems
Profile View. Allows the system to be seen in a side view for any defined profile. System data and results are still accessible but editing is not allowed. Fast switching between plan and profile view.
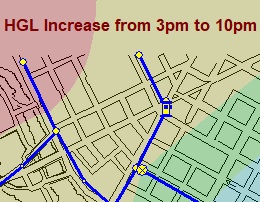
New Way to View the Difference between Two Parameters
Calculates the difference between two parameters and creates node emphasis and/or contours based on these values.
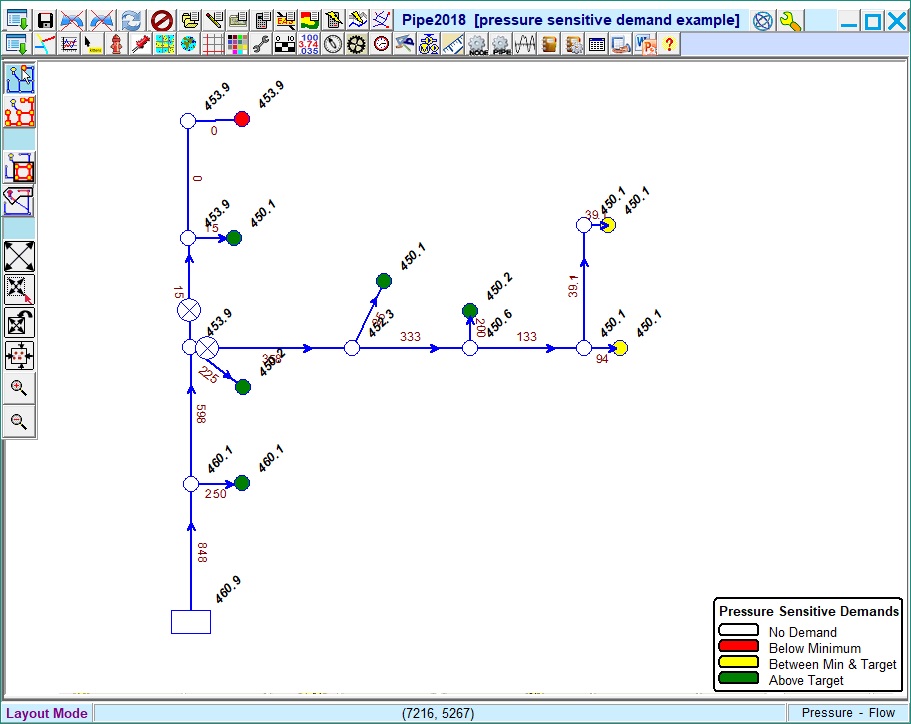
Adjusts Flow Rates to Meet Specified Pressures
The Pressure Sensitive Demands feature adjusts the flow rate at demand nodes until specified system pressures are met.
-
-
-
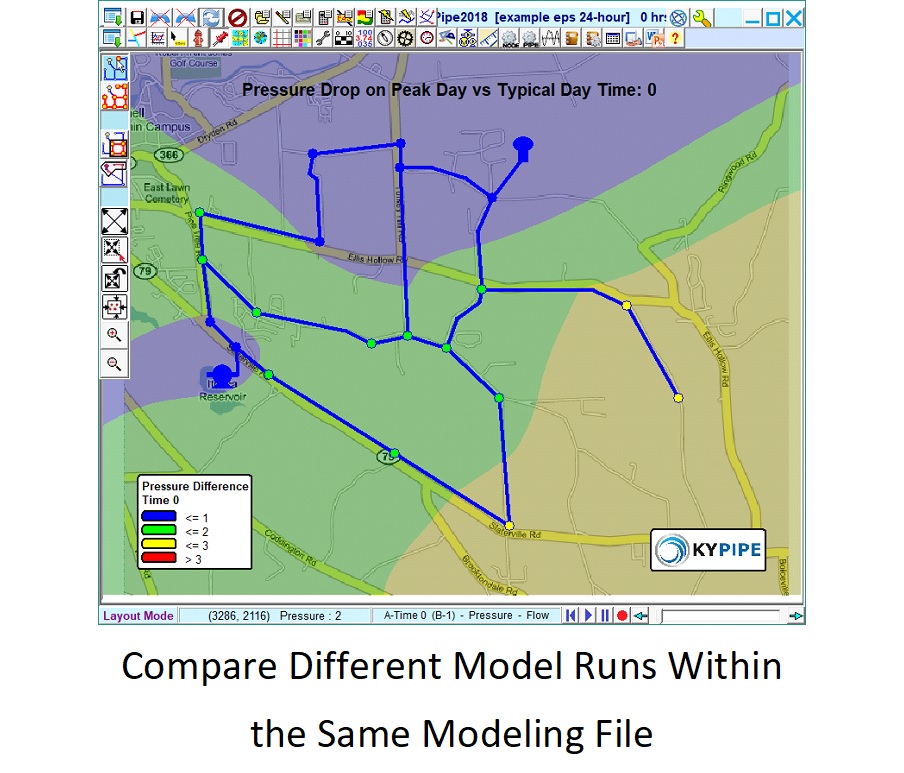
Comparing Different Model Runs
Similar to saved views, this feature allows users to load, save and compare results within a modeling file – no need to create new files to see the effect of changes.
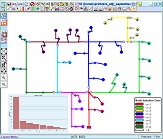
Zone Emphasis and Report
Emphasize isolation zones using contours or pipe colors. View a report showing the demand per zone and a histogram denoting percentage by zone or absolute flow values.
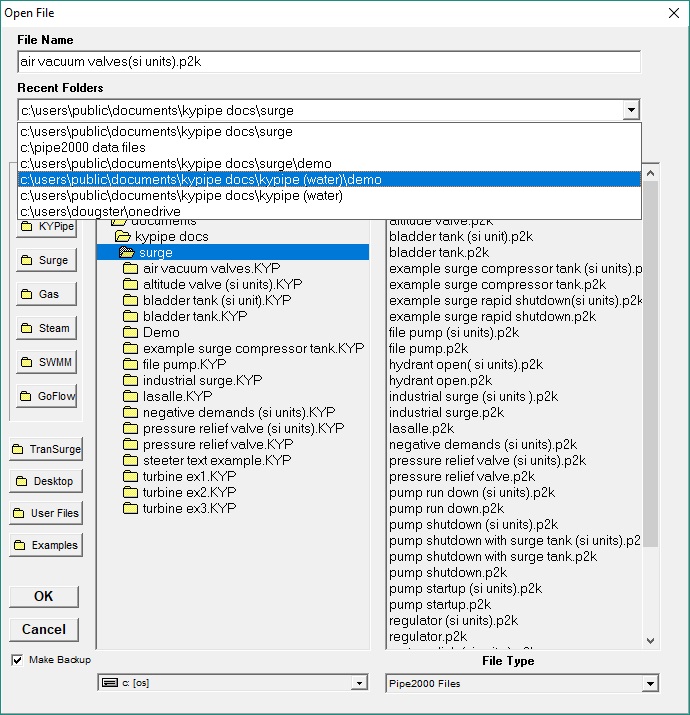
Recent Folders Drop-Down List
Recent Folder Option in the File Open/Close Menu. Search for model files in recently-used folders without having to navigate to them.
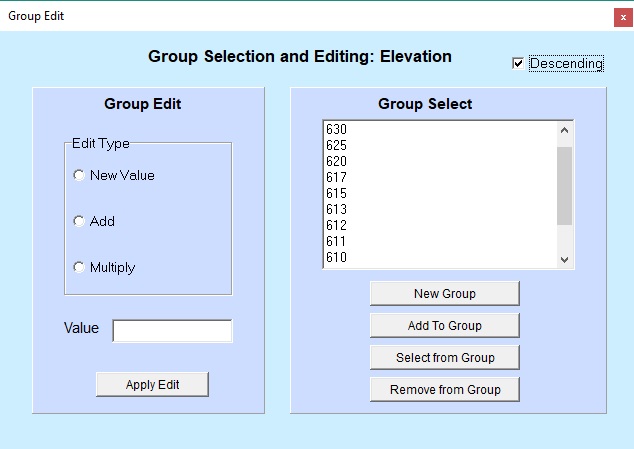
Descending Sort
Sort Items Descending in Node Group Select (KYnetic). Sort nodes in descending order by characteristics such as elevation, hydraulic grade, demand, etc.
Alter Pipe Thickness
Change the thickness of pipes to emphasize hydraulic variables such as pipe diameter, roughness, flow, etc.
-
Profile Data to Excel
Export Profile to Excel. Exports node name, elevation, distance, HGL, pressure, min HGL and max HGL. Click on the Print Button within the Animated Profile Menu to access this feature.
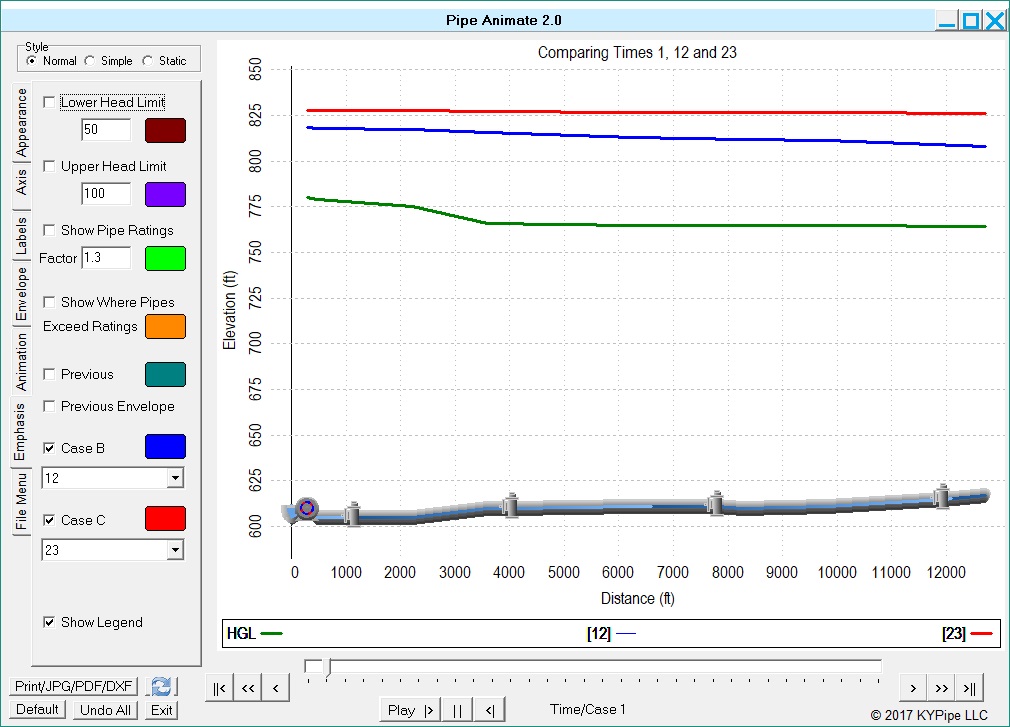
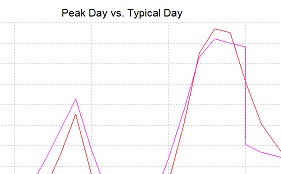
Case C Option
Display Case C. Formerly the pressure results from two different times or cases, Cases A and B, could be plotted within the graph of the Animated Profile; now a third option, Case C, can be plotted as well.
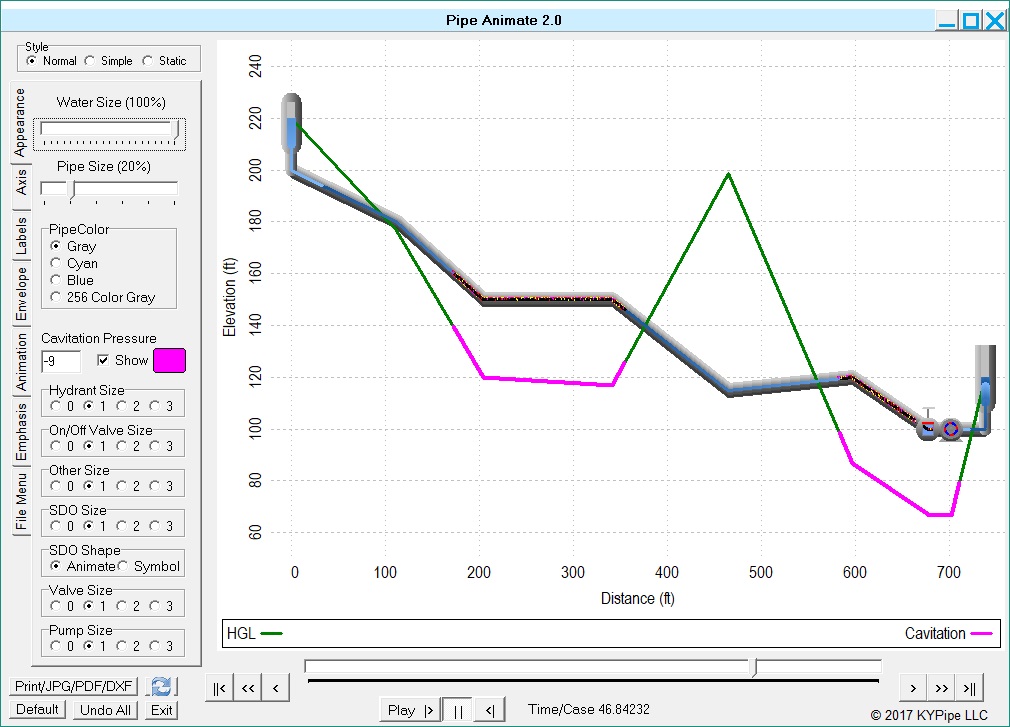
Cavitation Emphasis
Cavitation Emphasis. Cavitation within the system can now be shown on the HGL line within the Animated Profile using a user-defined color.
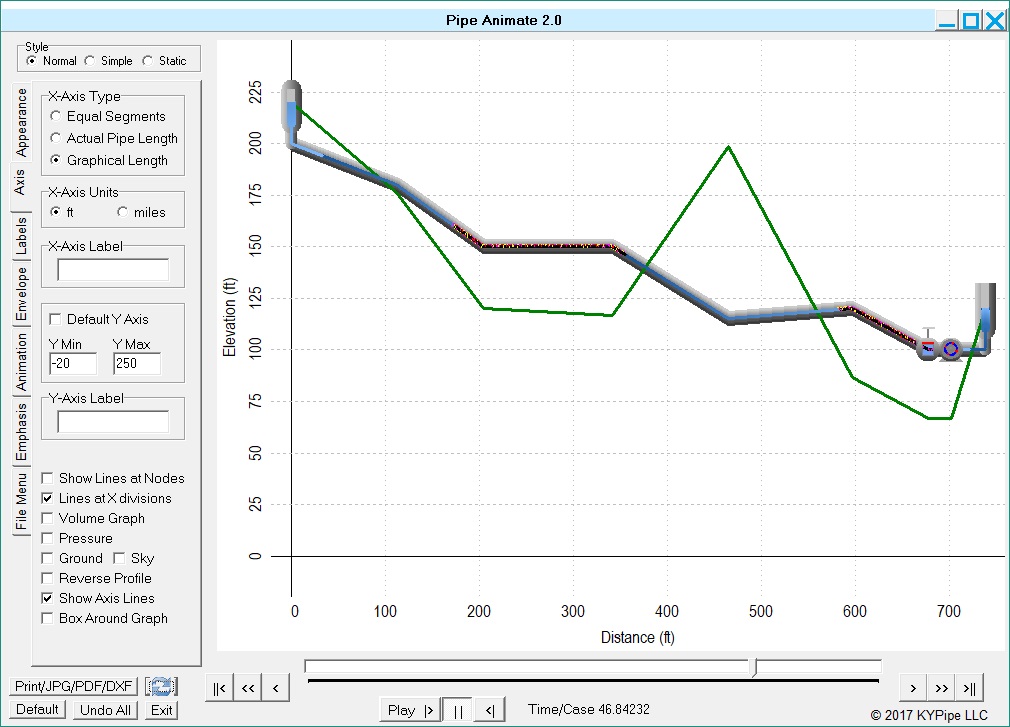
Axis Lines
Show Axis Lines. Users can now add solid lines to show the x- and y-axes.
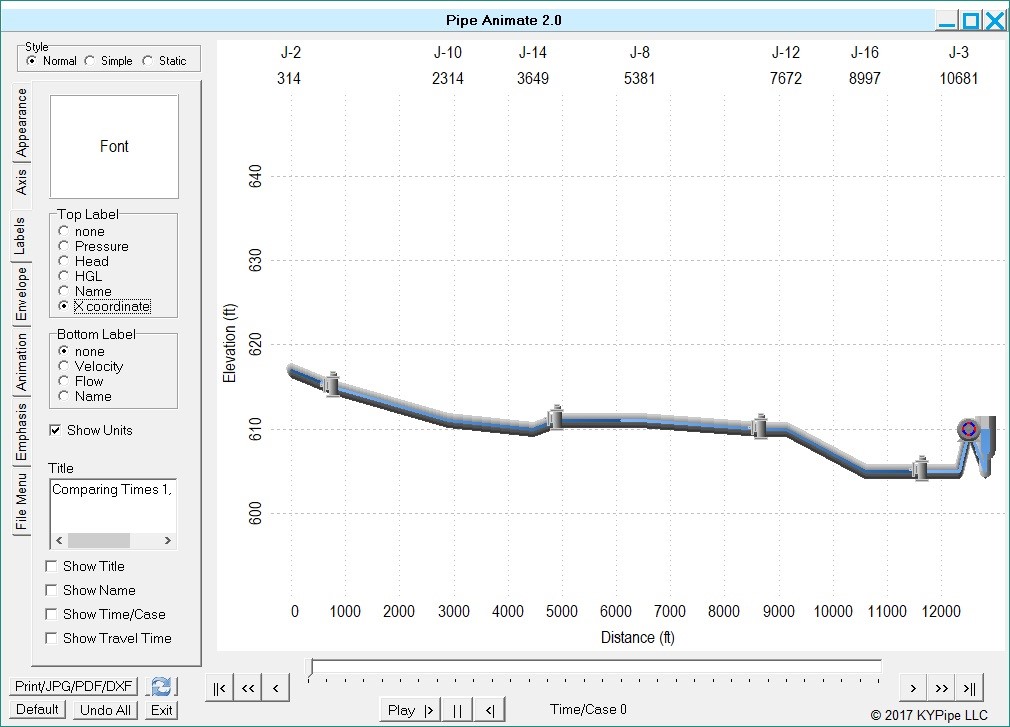
X-Coordinates
Display X-Coordinate. This feature displays the actual x-coordinate of each node used in the layout of the system: useful for systems that are on a different scale or do not have the same origin as the profile.
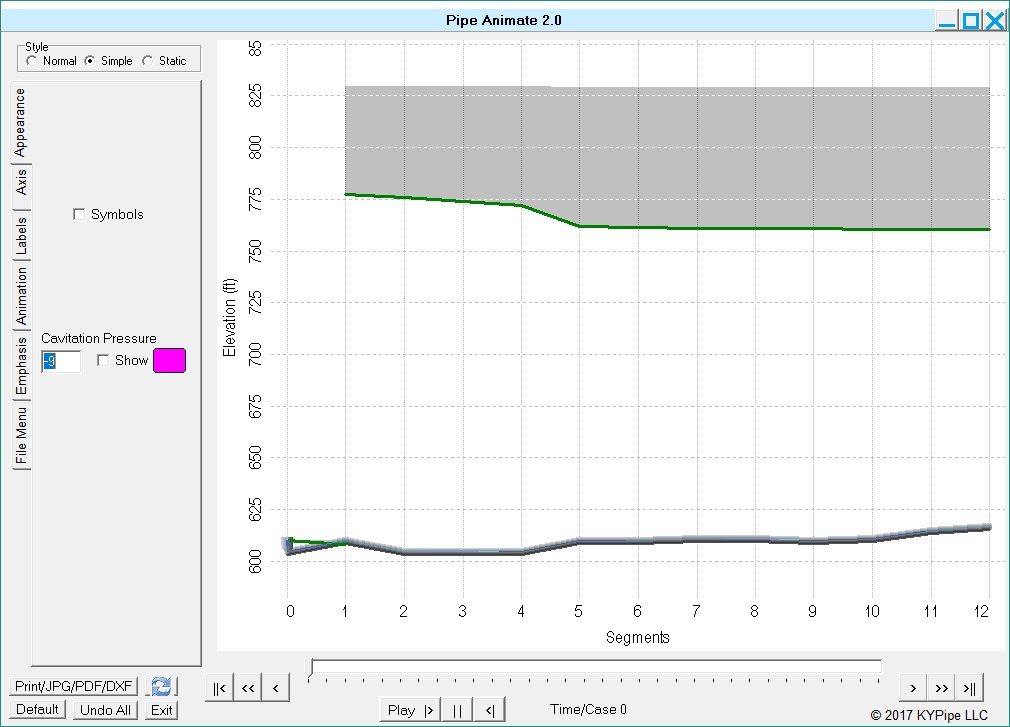
Simple Mode: Symbols On/Off
Simple Mode. Turn off the node/device symbols along the animated profile to better see the system elevations.
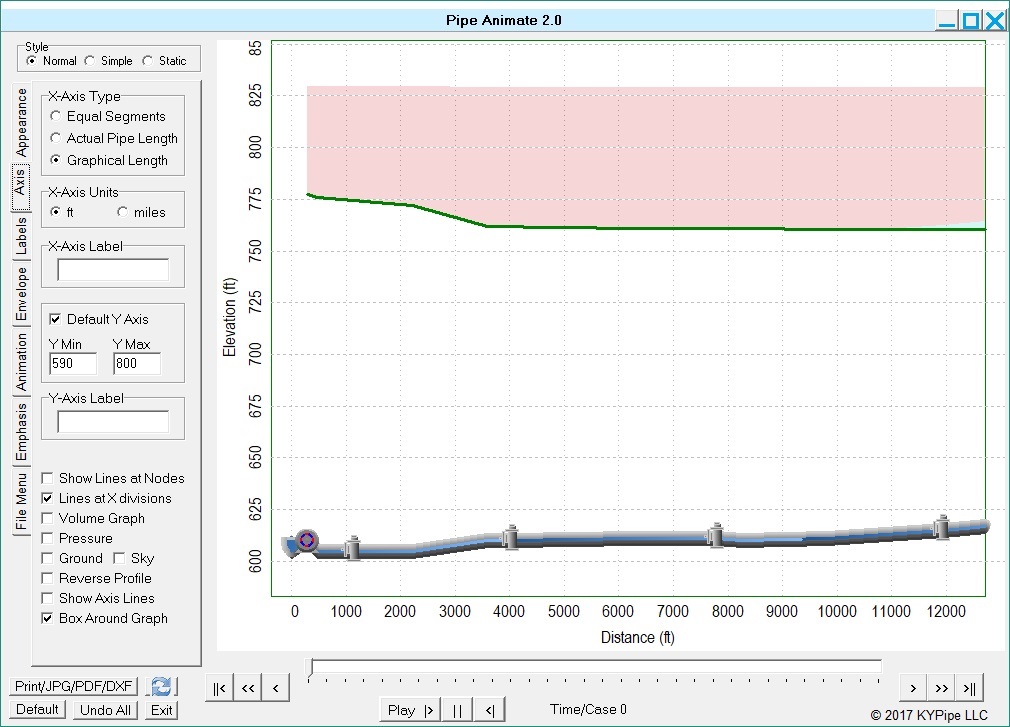
Box Around Graph
Draw Box Around Graph. Add a box outlining the graph.
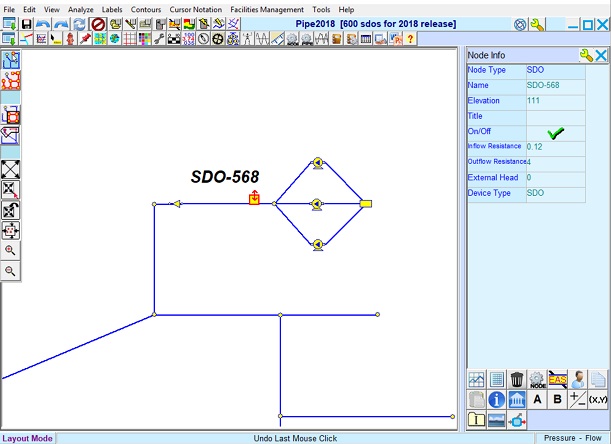
600 SDOs Now Available
Side Discharge Orifice Number Increased – the allowable number of SDO surge protection devices has been increased from 300 to 600.
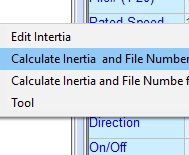
Calculate inertia and Suter Curve File Number
This tool automatically calculates inertia based on the pump efficiency, speed ratio, rated speed, rated head, and rated flow. It also determines a best-fit Suter Curve File Number.
-

-

-
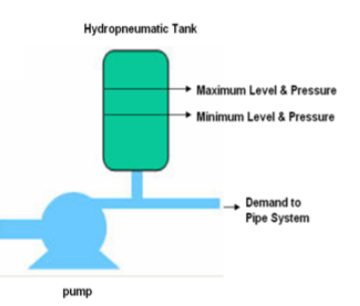
Pump Cycles
Model hydropneumatic tanks to control pump cycles for systems where demand is less than the available pumping capacity. This reduces pump shutdown and startup cycles which increase wear and tear on pumps and cause system pressure transients. More…
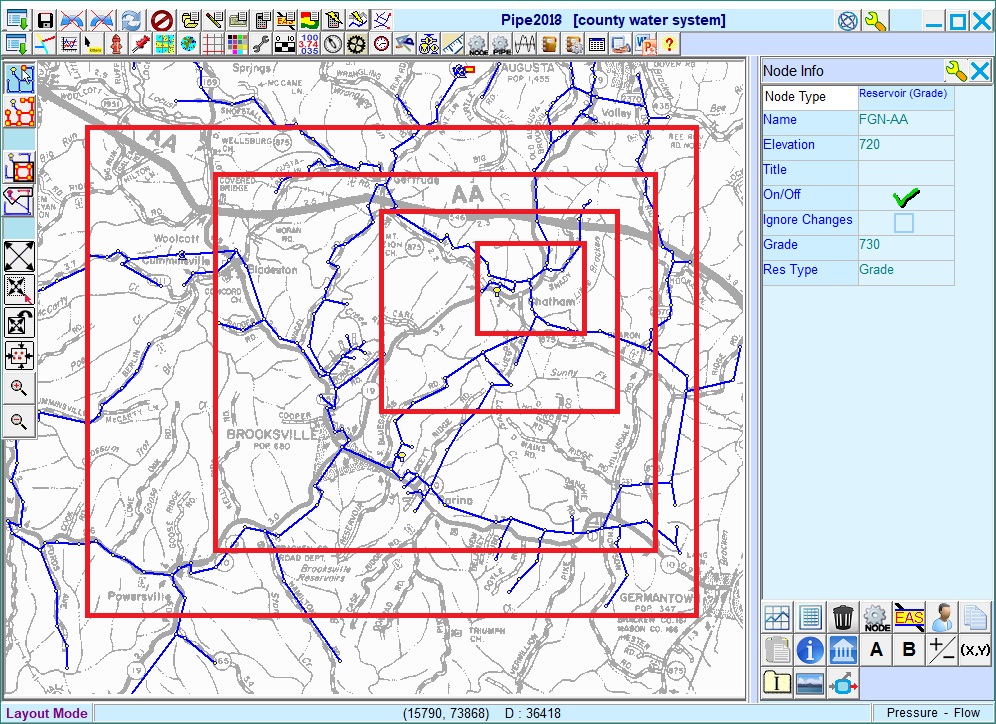
Copy Node Changes to Legend
Copy Node Changes to Legend. Reports all node changes within the legend in the Map Area.
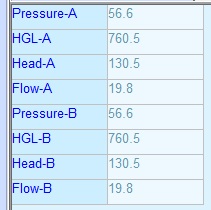
4 Results Displayed
Displays all Four Results for Nodes and Pipes in Info Windows. Display flow, head, pressure and hydraulic grade line simultaneously for two different cases or times.
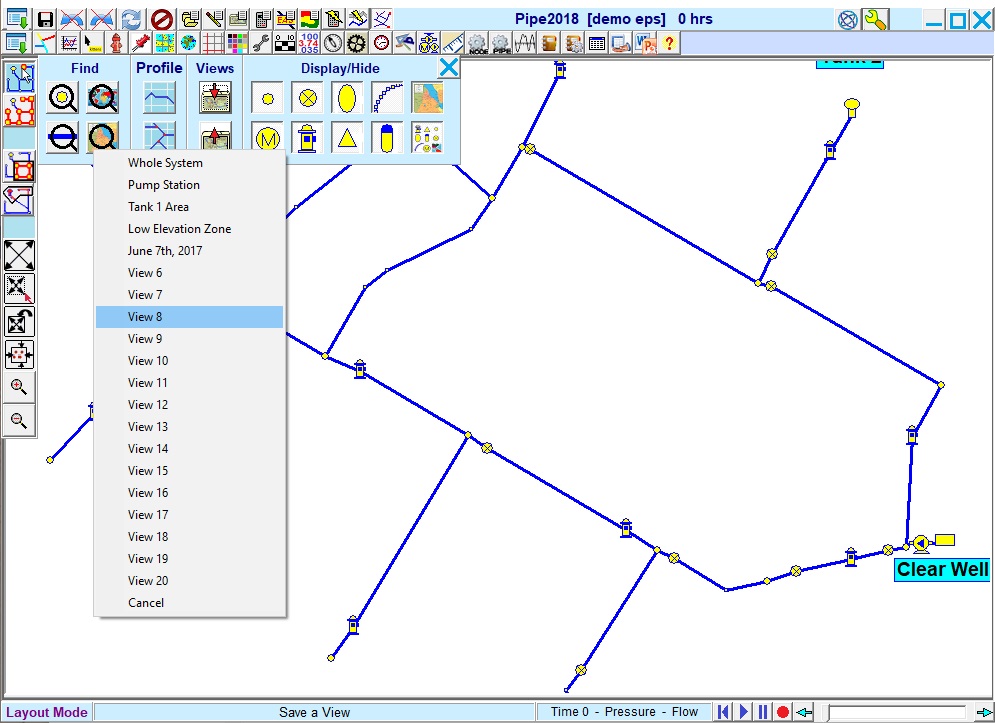
Now 20 Saved Views
Increased number of Saved Views. Users can now save up to 20 views instead of 7.
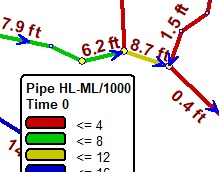
Loss, Loss/1000
Loss-Loss/1000 Option for Pipe Emphasis and Labels. Use head loss and head loss per thousand feet (or meters) to label and emphasize pipes.
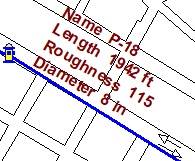
Multiline Pipe Labels
Multiline Pipe Labels (KYnetic). Displays one label item per line instead of all on one line.
Zoom Lock
Zoom Lock (KYnetic). Right Click Zoom Windows or Ctrl-Shift-W.
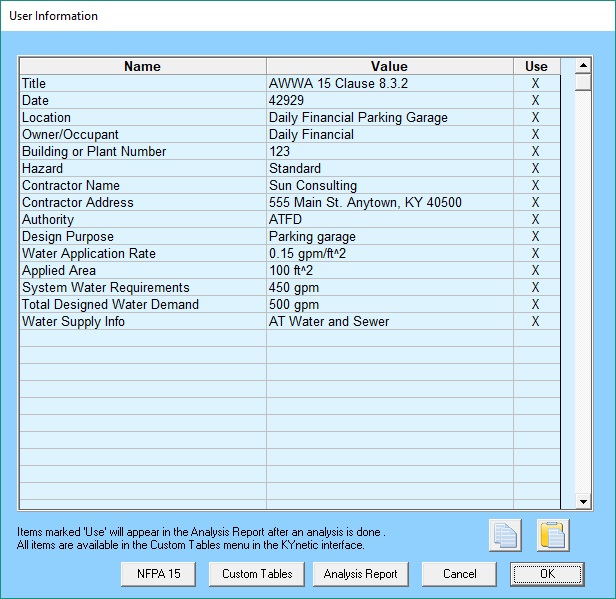
Customize Tables and the Analysis Report
This function is available from the System Data Menu. It allows the user to customize the Analysis Report or to create custom tables.