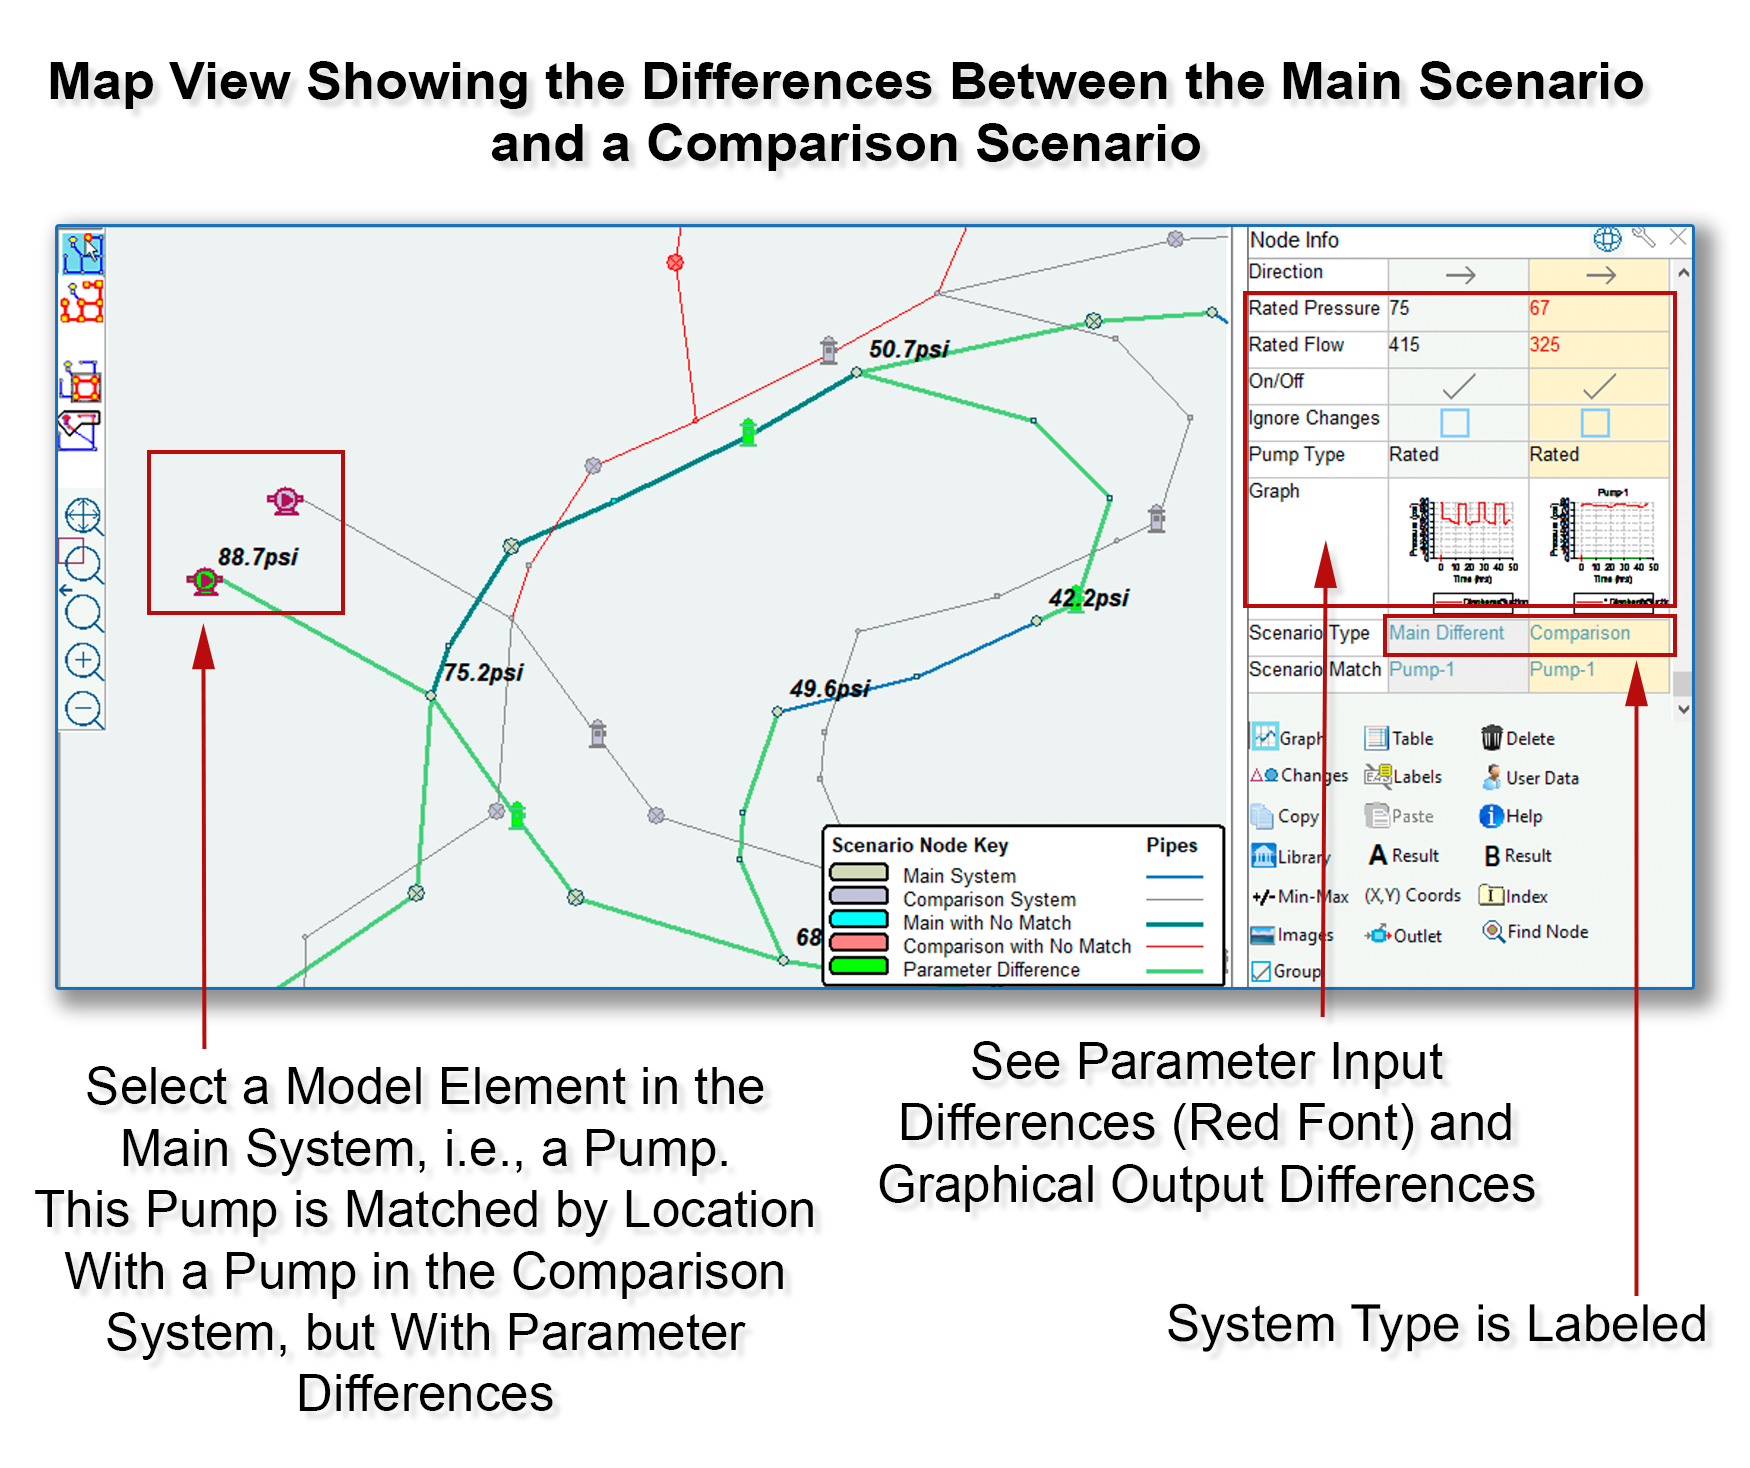
This feature allows users to compare and edit different modeling files (i.e., .p2k files) simultaneously. For purposes of this feature, modeling files will be referred to as systems, or scenarios. Two different scenarios can be viewed and edited within the Map Area (or Map View, first image below), and up to four different scenarios can be viewed and edited in the Table View (second image below). However, users are not limited to four scenarios, any number of scenarios can be managed, although only 2 to 4 can be viewed at once.


This feature includes the following functions:
1. Comparison of Model Elements
Within the Map View, by default the Main Scenario (or Main System) is loaded for editing. However, users can choose to also display a Comparison Scenario (or Comparison System), whose position on the map can be offset to prevent overlap, as shown in the image above. All pipes and nodes (i.e., all model elements) are labeled based on whether or not they are matched between the two scenarios.
There are two ways pipes and nodes can be compared: the first is that they can occupy the same physical space; for nodes, this means they are in the same X,Y location. For pipes, this means that the end nodes that define the pipe must both be the same X,Y location, although the pipe length/path can be different. Once elements have been determined to be a match based on location, they are divided into matches that also have input parameters which are exactly equal (for instance, elevation in the case of nodes, roughness and diameter in the case of pipes), and those that have input parameter mismatches. An element which is has common names and inputs between the two model files, but which is not in the same location, will not be displayed as a match. Below is an image of the key showing the different colors used to label model elements based on these criteria.
Matching Tolerance. Model elements are matched by location within a certain tolerance. This tolerance is expressed as a radius around the X, Y location of the elements. The tolerance radius defaults to 10 map units (i.e., feet or meters depending on whether the model is in English units or metric), but this amount can be adjusted by the user. To change the default tolerance, uncheck the box titled, “Auto Tolerance,” enter a value in the User Tolerance Field, and click on the Refresh icon, as pictured below.

2. Edit Model Element Input Data in Map View
Users can view all model elements in the Map View for both the Main System and a single Comparison System. Comparison Systems can be swapped as needed. Selecting a node or pipe in the Main System which has a match in the Comparison System causes both elements to be displayed within the Pipe Info Window or Node Info Window, see the image below. An additional field appears within the Info Window stating which element is assigned to the Main Scenario and which is assigned to the First Comparison Scenario. The word “Different” also appears if the elements are matched by location but have differing input parameters. Elements within the Main Scenario can be edited directly within the Info Windows; elements from the Comparison Scenario are not directly editable; however, the scenarios can be swapped to allow editing.

3. Use the Table View to Compare and Edit Nodes or Pipes
The Table View is a Microsoft Excel spreadsheet which displays up to four total scenarios (the Main Scenario plus up to three Comparison Scenarios) in adjacent columns. This allows users to see which nodes or pipes are present in the Main Scenario, but not present in in the Comparison Scenario(s). Likewise, the Table View shows which nodes or pipes are present in the Comparison Scenario(s) but not in the Main Scenario. Also, this feature allows the user to view parameter differences between pipes or nodes which are present in more than one scenario. Users can then edit any scenario within the Table View without exiting.

4. Analyze Both Systems and View Results (Map View and Table View)
Users can analyze both systems without having to exit the Map View portion of the Scenario Management Feature. Users will be prompted to save the Main Scenario before the analysis can proceed. The results of the analysis can be displayed as labels within the Map Area for the Main Scenario, for the First Comparison Scenario, or for both. Users can also see results for model elements in graphs or in tables by clicking on the thumbnail within the Node Info and Pipe Info Windows, as normal, without having to exit the Scenario Management Feature.
Likewise, the Main Scenario and up to three Comparison Scenarios can be analyzed in Table View without leaving Table View, and the numerical results can be seen for each node and pipe.
5. Fix Names
The Fix Names Feature automatically renames elements in the Comparison Scenario(s) which are matched with elements in the Main Scenario (by location) so that node and pipe names are common to all scenarios. The element name from the Main Scenario is applied to the Comparison Scenarios during this process. Users can swap the First Comparison Scenario with the Main Scenario prior to using this tool if the element names from the First Comparison Scenario are preferred.


