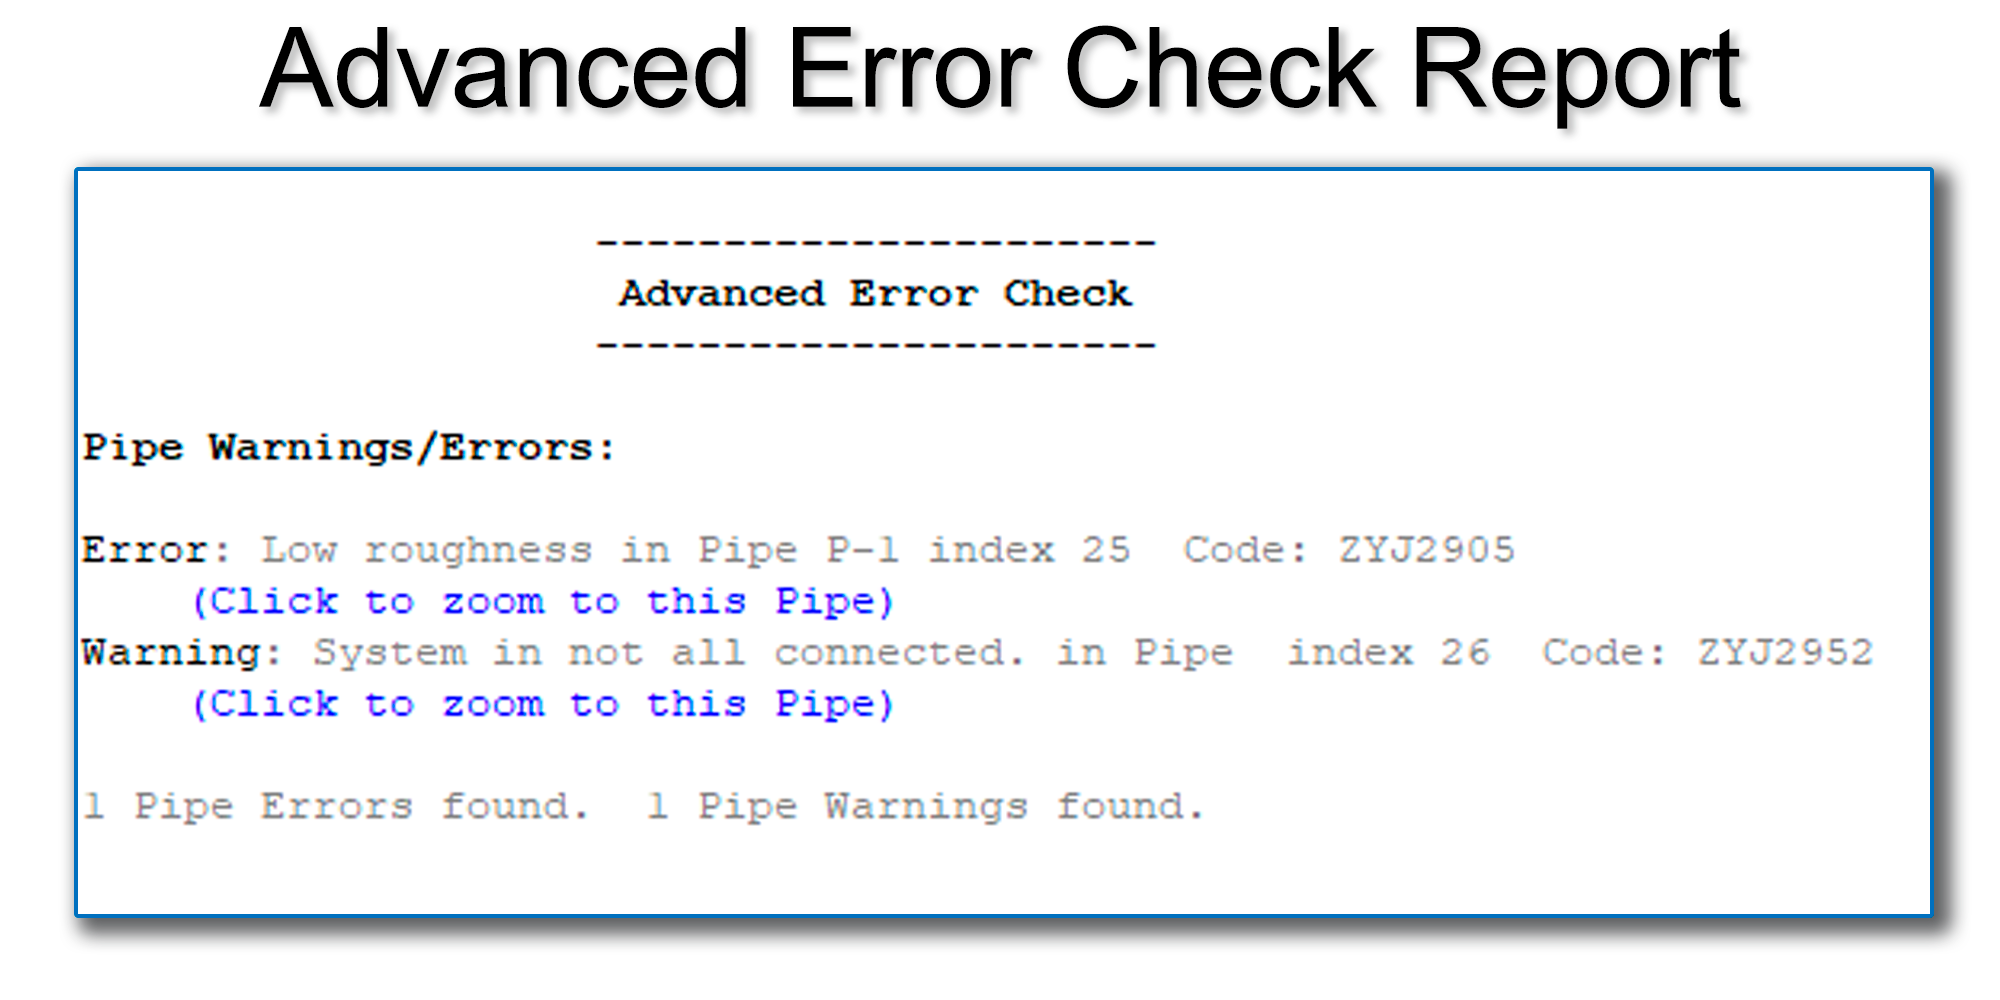
Advanced Error Check Feature. This feature creates a centralized list of Error Messages and Warning Messages compiled from decades of technical support and model troubleshooting experience, reporting both critical errors and settings changes (warnings) that may not be immediately apparent when the model is analyzed.
This list can be generated before an Analysis has been run, placing the user just one click away from the List of Errors/Warnings before conductiong the analysis. See more here (Advanced Error Check).
Create animated or simple pipe profiles for pipelines or a path through a looped system. Specify the first and last nodes and the rest is done automatically. HGL envelope and results may be displayed.Learn more
Specify a demand and it will be spread throughout the system automatically. Control whether the demand is distributed evenly or if smaller pipes are favored. Learn more
AutoSave is automatically enabled when creating new files, but may be turned off by the user. The time interval for autosaving may be set by the user, but defaults to 10 minutes. Autosaved copies are not automatically implemented; load any autosaved copy from the Autosave Menu, then save it manually, and it will become the working copy. The user is prompted before autosaving, and an option exists to accept or skip the autosave.
Overview (KYPipe and Surge, KYnetic only). This tool shows the check valve position at all simulation times. it displays an animation of a check valve associated with a pump, showing positive pressure, sub-zero pressure and cavitation pressures in both the inlet and outlet side of the pump. Useful for diagnosing check valve slam and check valve chatter. Play the full simulation time from the beginning, or use a slider to freeze or go back for a portion of the simulation.
View Pump Inlet and Outlet Pressure Gauges and Flow Arrows. Pressure gauges are shown within the animation with default or user-defined pressure ranges; the gauge needle turns red during periods of cavitation. Flows in and out of the pump are represented by vector arrows which change direction and scale. The scale can be left at the default setting or changed by the user.
Immediately See Positive, Negative and Cavitation Pressures. The animation displays three different images for the water within the pump inlet and outlet pipes, depending on whether the pressure in the pipes is positive, negative but not cavitating, or below negative atmospheric pressures, indicating cavitation. Learn More
This graph displays the position of the check valve throughout the simulation period, with a position of zero representing a fully-closed check valve, and a position of 1.0 representing fully-open check valve. This graph is available within the check valve animation feature and as part of the normal node output graph by clicking on any pump with a check valve. Thus the check valve position can be plotted against other output parameters such as suction and discharge pressure as well as pump speed. (KYnetic Only). Learn more
Connects disconnected pipes. If pipes cross but are not connected, this feature will add a junction node at the connection point (KYnetic only). Improved for 2026, now end nodes that are disconnected from pipes can be automatically snapped to the nearest pipe. Formerly, only hydrants, meters and on/off valves could be snapped to the nearest pipe. Learn more
Set and adjust boundary conditions at different nodes throughout the system (pumps, valves, etc.) to reach a user-designated pressure at a selected node within the system. Learn more
Prior to Pipe2024, KYPipe incorporated a Total Inventory feature, which returned cost totals for the piping and devices within each model, along with an Inventory Report. The Inventory Report included summaries of Total Pipe Volume, a Fittings Summary and Fittings Cost(s).
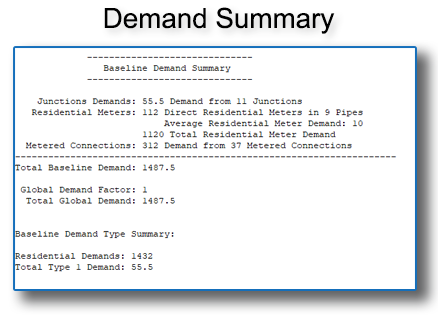
For Pipe2024, we have added a Demand Summary to the above features. The Demand Summary calculates the total demands present in the model, but also breaks down the demands by device type (Junction Demands, Residential Meters in pipes, and Metered Connection Nodes), and by Demand Type (e.g., R (Residential), Type 1, Type 2, Type 3, etc.).
The Demand Summary also returns the current Global Demand Factor (which is normally 1.0 for average demands, > 1.0 for peak demands, and < 1.0 for slack demands).
Last, this new feature incorporates a Device Summary which returns the total numbers of different devices (pumps, valves, tanks, etc.) in the model.
This feature allows users to input an allowable node pressure range (e.g., 30 psi to 100 psi for a municipal system), and the software determines the difference between the pressure at any given node and the upper and lower ends of the range. Specifically, the Design Point is defined as the percent difference between the user-defined upper/lower pressure limit for each node (which are set using either the Global Values or Local Values) and the pressure value calculated for that node by the model during analysis. So, for example, if the Design Point = 75.5%, then the calculated pressure is 75.5% of the way to the Design Point. The formula for calculating the design point is 100% * (Value – Min Value)/(Max Value – Min Value). Learn more.
Import demands to junction nodes or as residential meters within pipes using an Excel spreadsheet to match junctions/pipes within the model to addresses (Premium Package only) or latitude/longitude values in the spreadsheet. Learn more
This feature allows users to calculate concentrations of disinfectant byproducts (DBPs) within a regular KYPipe Water Quality model.
First, users select the analysis type, Chemical Concentration or Water Age.
For tanks and reservoir nodes, the user inputs the initial chlorine concentration directly. For other point sources (Node Source Data), there are 4 different options to specify the chlorine levels – concentration, mass, flow-paced and set point. These values are converted into chlorine levels in mg/l.
For all three types of nodes (tanks, reservoirs, and point sources), the software accommodates alterations to the source concentration levels based on the pattern data.
For concentration-based analyses, the chlorine demand X at any point/time in the model is calculated by determining the average concentration of the chlorine residual at all sources (nodes), and then subtracting the calculated chlorine concentration at each individual node within the model.
For Water Age-based DBP calculations, the Water Age is calculated at each individual node within the model throughout the course of the simulation.
Learn more here (DBPs).
Change demands within the model for different times or cases – demand patterns can be created for individual demand types (residential, etc.). Demand patterns entered into the Demand Pattern Table may be saved for use in other models. Learn more
Varies a parameter value within a specified range to see the effect on the system. The parameter is associated with a double-sided node such as a pump or valve. The user selects a parameter within the node input data, then defines an allowable range. The program will run multiple analyses simultaneously to output the variation in the remainder of system based on iterative values within the allowable range. For instance, vary the flow coefficient of a valve to see the effect on the system pressures and flows. This is a KYPipe-only feature, available within the KYnetic Interface and the KYnetic Ribbon Interface. (KYnetic Only). Learn more
Direct Parameter Calculations are calculated to exactly satisfy stated pressure requirements at designated locations in the piping system for a range of operating conditions. Learn more
KYPipe node elements include junctions, tanks, reservoirs, pumps, sprinklers, rack sprinklers, regulating valves, loss elements, and loss elements defined by manufacturer’s data from a library. Learn more
Expanded Rural Analysis modifies your model based on the demand fluctuations (peak demand requirements) encountered in a rural or branched hydraulic system. Learn more
An Extended Period Simulation simulates extended periods (e.g., 48 hours) with pump and tank controls, demand curves, and boundary changes (alterations to node or pipe parameters/status). Learn more
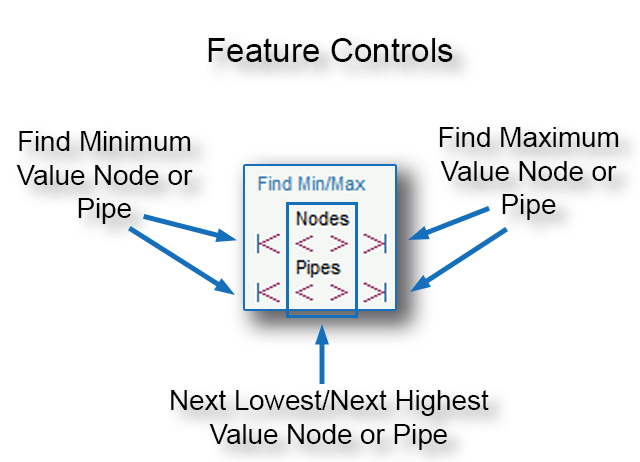
This feature toggles sequentially between nodes with higher or lower values of Result-A, including buttons to immediately display the node or pipe with the highest or lowest value of Result-A. Result-A is a placeholder that can be set to display the following system variables:
Nodes
The software allows users to select from multiple friction equations: Hazen-Williams, Darcy Weisbach, Manning, and a modified Hazen-Williams equation which is commonly used in India and is recommended by the Government Agency CPHEEO (Central Public Health and Environmental Engineering Organization).
This feature allows users to import elevation data from a tab-delimited text file. Elevation data can be georeferenced by X, Y location relative to an origin point in map units (feet or meters), or using latitude-longitude coordinates (decimal degrees). In this manner, ground survey data points or lidar-collected data points can be imported for use as an Elevation Grid. The Elevation Grid allows the elevations of existing nodes to be automatically updated using interpolated grid elevations. Learn more.
Users can click on a pipe to show the location of an intrusion, and the Intrusion Calculator indicates which valves to close to most efficiently isolate the point of the intrusion. This tool generates a report detailing the affected piping volume and the isolated areas: these are parts of the system not directly affected by the intrusion, but which are no longer connected to a source (tank, reservoir, other water system) due to the closed valves. Learn more
The KYnetic Ribbon (KYnetic only) enhances navigation using a combination of text and icons. Collapse the ribbon to use the original KYnetic Toolbar. Learn more
The Operational Control Screen is a unique and very useful tool for presentations and operational and design studies. There is no better tool for presenting the impact of changes in operation of a distribution system. Learn more
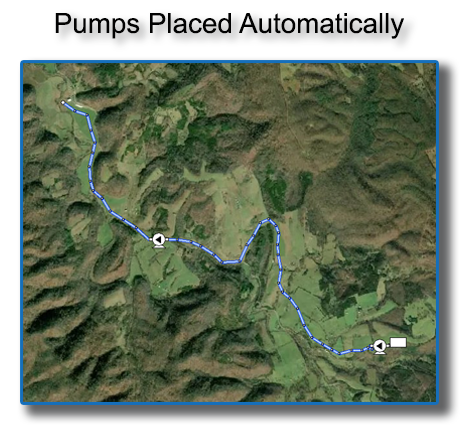
Optimal Pump Placement Tool. This Tool selects fom a user-supplied list of availabe pumps, and generates the layout for a least-cost pump optimization plan along a single (unbranched) pipeline, considering the following factors for all available pump types:
Pump curves.
Unit cost.
Number of each type of pump in inventory.
It then selects and places the optimum number of pumps along the pipeline, maintaining a user-required minimum flow rate as well as both user-designated minimum and maximum system pressures.
Optimal Pump Scheduling computes the most economical and efficient way of operating complex water distribution systems with multiple pump stations. Learn more
The Optimal Water Quality Sensor Placement Tool (OWQSPT) is a simplified guidance tool for optimal placement of sensors in small- and medium-sized water distribution networks. Learn more
Optimized Calibration minimizes the difference between observed field data and model predictions considering all test data simultaneously to provide the best calibration possible. Learn more
The user specifies which portion of the system is affected by a pipe break. The pipes affected by the break and the nearest on/off or active valves are highlighted, showing which valves need to be closed in order to most efficiently isolate the break. Users can click on valves to open or close them and thus see different scenarios. This tool will create a report showing the pipes affected, the valves to close, the number of affected customers, and the volume of water within the affected pipes.
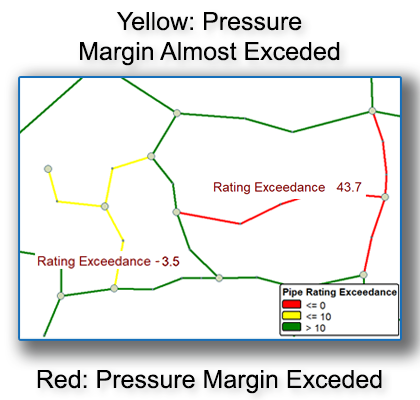
The Pipe Ratings Exceedance feature combines several tools that help users to determine if pressures within the pipes in the model exceed their manufacturer’s pressure rating, at any point in the simulation. View more details at this link (Pipe Ratings Exceedance feature). These tools include:
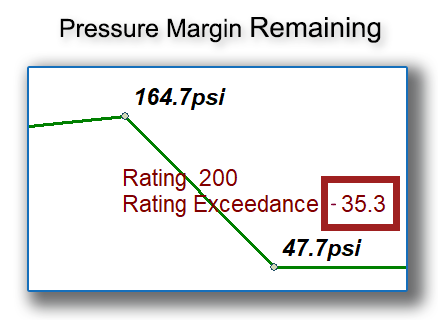
1. Labels in the Map Area. These labels show the pipe pressure rating, and the amount by which the pipe pressure rating was exceeded. In the image shown below, a positive value for the rating exceedance indicates that the pipe has this much margin before its pressure rating is exceeded. The margin is 35.3 psi (200 -164.7 = 35.3 psi)). By convention, the negative sign means that the pressure rating has not yet been exceeded (the exceedance is negative, or said another way, the margin is positive).
2. Pipe Emphasis. The Pipe Emphasis tool uses a color-coded key to show which pipes exceed their pressure rating, and which pipes are flagged as cautionary – that is, they are within 10 psi of their pressure rating, but they have not yet exceeded the pressure rating. Pipes which have exceeded their rating are shown in red, and pipes with a cautionary warning are shown in yellow. Pipes which have not exceeded their pressure rating are shown in green. Units are psi:
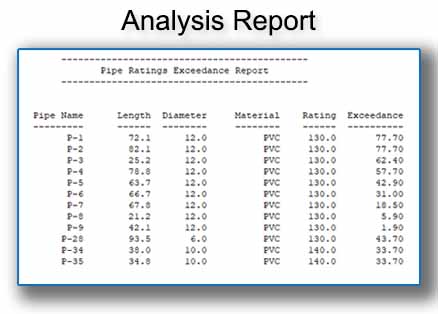
3. Analysis Report. The Analysis Report lists all pipes that have exceeded their pressure rating, along with the pipe’s physical characteristics, and the amount by which the pressure rating was exceeded, in units of psi.
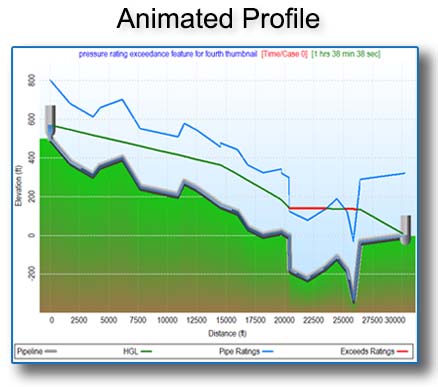
4. Animated Profile. The creates an Animated Profile with the pipe pressure rating graphed as a head value line, along with the pressure within the pipes of the model graphed as an HGL line: Wherever the HGL line of the model’s pressures rises above the pipe’s pressure rating line, that pipe’s pressure rating has been exceeded, and the pipe is displyed using a red color, see the image below. Units are feet of head:
During model creation, select the Pipe Type from one of many Pipe Schedules and the pipe data fields are automatically filled. Users can create a customized schedule which is reuseable in multiple models.
Create detailed PowerPoint, Word & HTML reports within the KYnetic interface. Add maps, images, videos, tables and graphs for dynamic presentations. Learn more
Allows the system to be seen in a side view for any defined profile. System data and results are still accessible, but editing is not allowed. Permits fast switching between plan and profile view.
QuickView limits map features, making loading and editing large modeling files faster. When a large model file is detected during loading, the interface automatically prompts the user with an option to enable this feature. It is automatically turned off when making presentations, or when the Map Refresh button is clicked. QuickView can easily be turned on and off while editing a file.
This analysis first determines which sprinkler in the system has the minimum capacity or lowest density, then analyzes the system with this element at the specified required capacity.
Compare and contrast different scenarios – view, edit, and analyze multiple scenarios in both the Map Area and in a Table View. In the Map Area, pipes or nodes which are different between the scenarios are highlighted in red. In the Table View, pipe and node input parameter differences are also displayed and highlighted. Learn more
Connects floating nodes to the nearest pipe. This is useful when adding hydrants, etc. from other software environments (such as AutoCAD, Google Earth or ArcGIS) to an existing model. Beginning in 2026, end nodes can also be snapped to the nearest pipe, making it possible to fully connect the model automatically. Learn more
Analyze the necessary water flow for each line and the pressure at each node to satisfy the fire water demand and meet industry standards. Includes fire hydrant color coding and a sprinkler supply plot. Learn more
KYPipe can run a single steady-state analysis, or multiple steady-state analyses within the same model, known as cases. Case 0 is always the baseline case, and cases are numbered sequentially from there (Case 1, Case 2, etc.). Each separate case allows one or more changes to be made to the baseline model, and model outputs can be compared between any two cases.
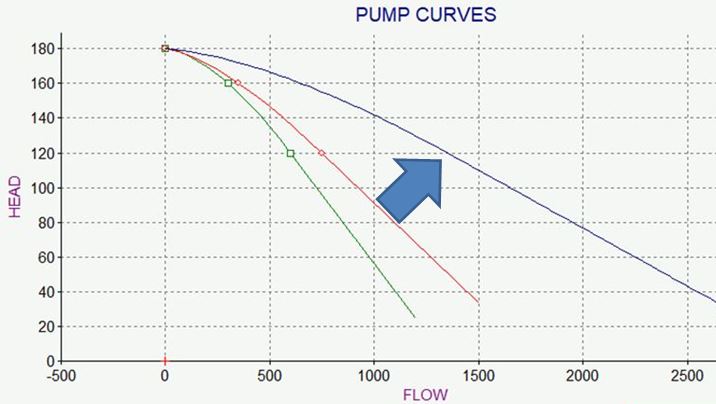
KYPipe can generate a system curve, against which can be plotted various pump curves, including pumps in series/parallel, as well as speed ratio values above or below a single curve to assist with pump design.
Standard storage tanks in KYPipe may now optionally be defined as overflowing, non-draining, or one-way. Storage tank levels can be controlled by pressure switches using various sensing nodes throughout the network.
Automatically calculate the number of pipes needed, pipe length, the cost for each pipe, & compute the total costs for all pipes in the system. Also,includes a complete inventory of system elements/devices, including total demands.
The Temperature Dependent Analysis feature allows users to model liquids with significant changes in density and viscosity at different parts of the distribution system. Learn more
The Water Quality Analysis feature determines the chemical concentration or the water age at any point in the system. A chemical trace can also be performed. Learn more
In the water quality calibration process, pipes can be automatically assigned distinct reaction rates, specifically Bulk Reaction and Wall Reaction rates, in order to match model-calculated data to field data. These rates are applied to pipe groups, and overall defaults may be defined for any pipes not included in the calibration process. KYPipe Premium Package only. Learn more
Sometimes issues occur when users run modeling files that are stored on external locations, including cloud locations, and shared or network drives. This feature is designed to allow users to seamlessly maintain project folders in these external locations. Upon opening a modeling file, this feature copies the file from the shared drive/remote folder to the local folder, and the user works from there until the file is closed. At this point, the modeling file is written to the shared drive. This is useful for users who are required to maintain a central store of files.
Click here for a list of features by package type (Basic, Standard, Professional, Premium): Packages.
We Are Available
Technical support for our software is free. Software developers and engineers are the experts who make up the KYPipe Technical Support team. Unlike many of our competitors, technical support for our users is provided at no additional cost. You may contact any one of a number of software developers and engineers with your questions about using the KYPipe suite of models.
HOURS – various team members cover these hours
Monday - Friday | 7 AM - 7 PM
Saturday | Closed
Sunday | Closed
Email and contact form 24/7 at - kypipe.com